
Rate Equations
Belajar sambil bermain
Jawab soal-soal ini untuk dapat energi, lalu memancing dan menjelajah. Tanpa akun.
Catatan pelajaran
State which rate you are measuring
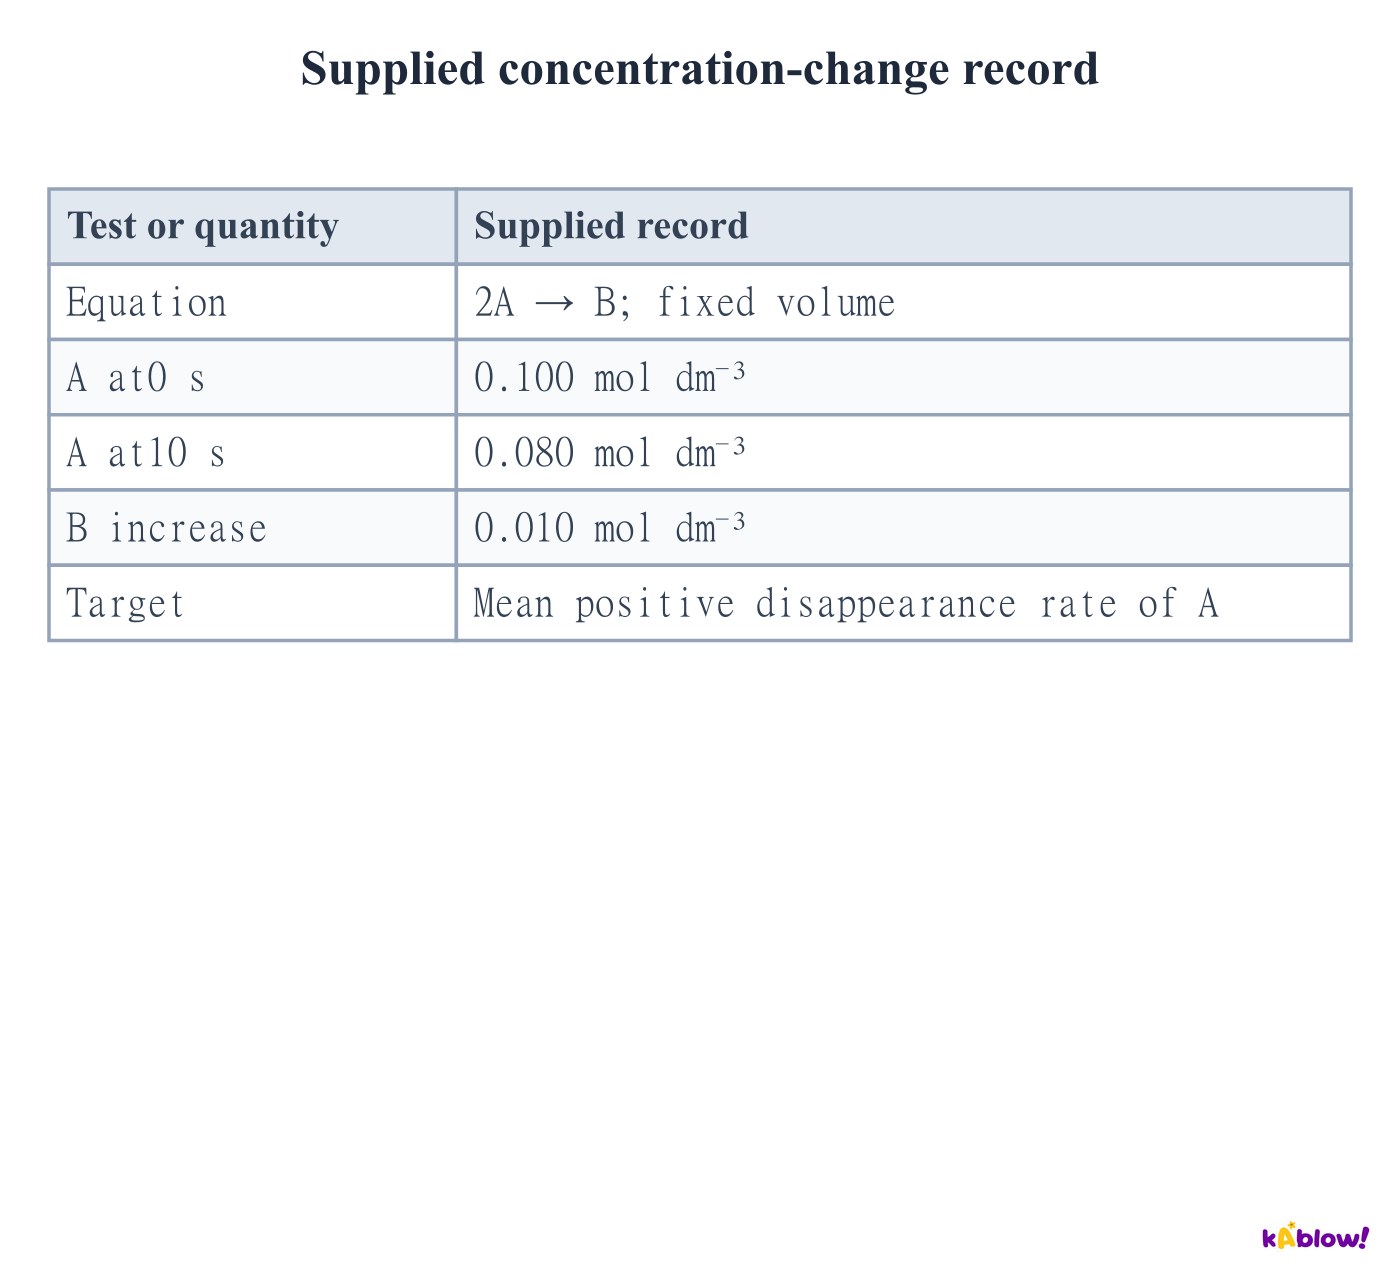
- A species disappearance rate is −Δ[A]/Δt and is positive when A decreases. A formation rate is +Δ[B]/Δt. State concentration and time units.
- For 2A→B at constant volume, disappearance of A is twice formation of B. The coefficient-normalised reaction rate is −½d[A]/dt=d[B]/dt.
- The supplied finite interval gives a mean rate. An instantaneous rate is obtained from a tangent at the chosen time.
Supplied concentration-change record
Read an empirical rate equation
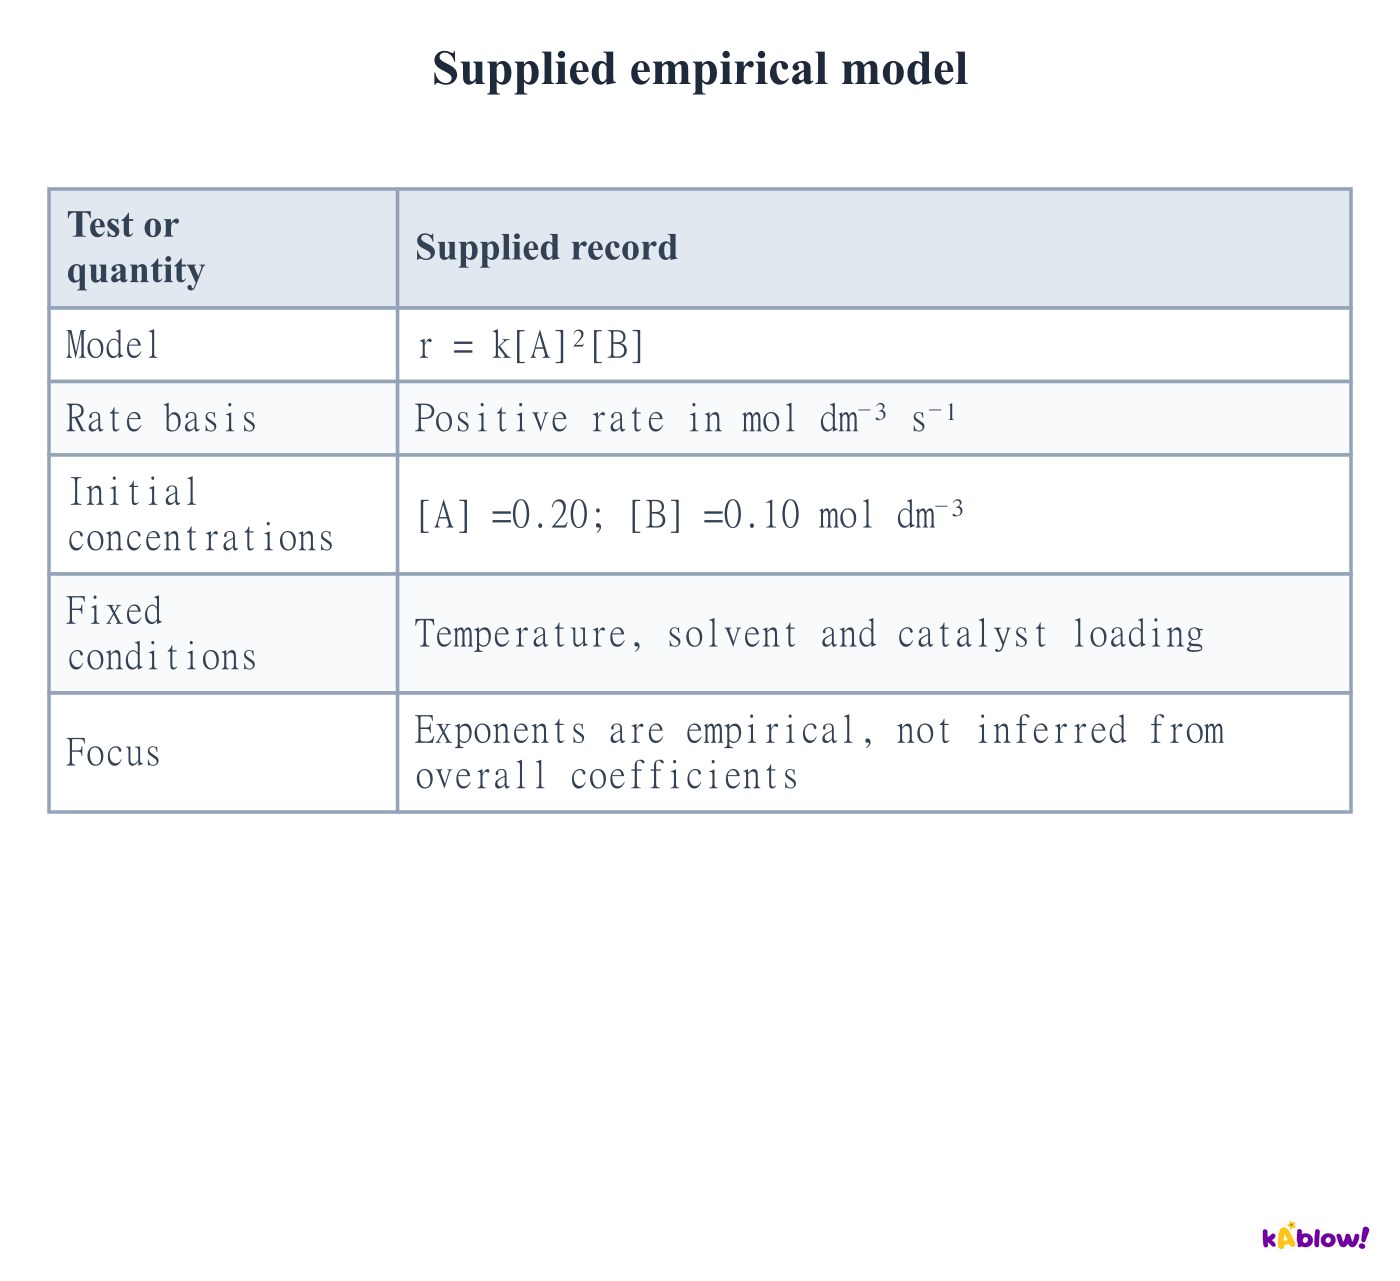
- In r=k[A]m[B]n, m and n are orders with respect to A and B. Overall order is m+n. Determine these exponents experimentally.
- The rate equation does not usually follow directly from overall reaction coefficients. AQA examples emphasise zero, first and second orders; other values occur in chemistry.
- For r=k[A]²[B], doubling A alone multiplies rate by four, while doubling B alone multiplies it by two. Use the same defined rate basis throughout.
Supplied empirical model
Recognise zero order from rate versus concentration
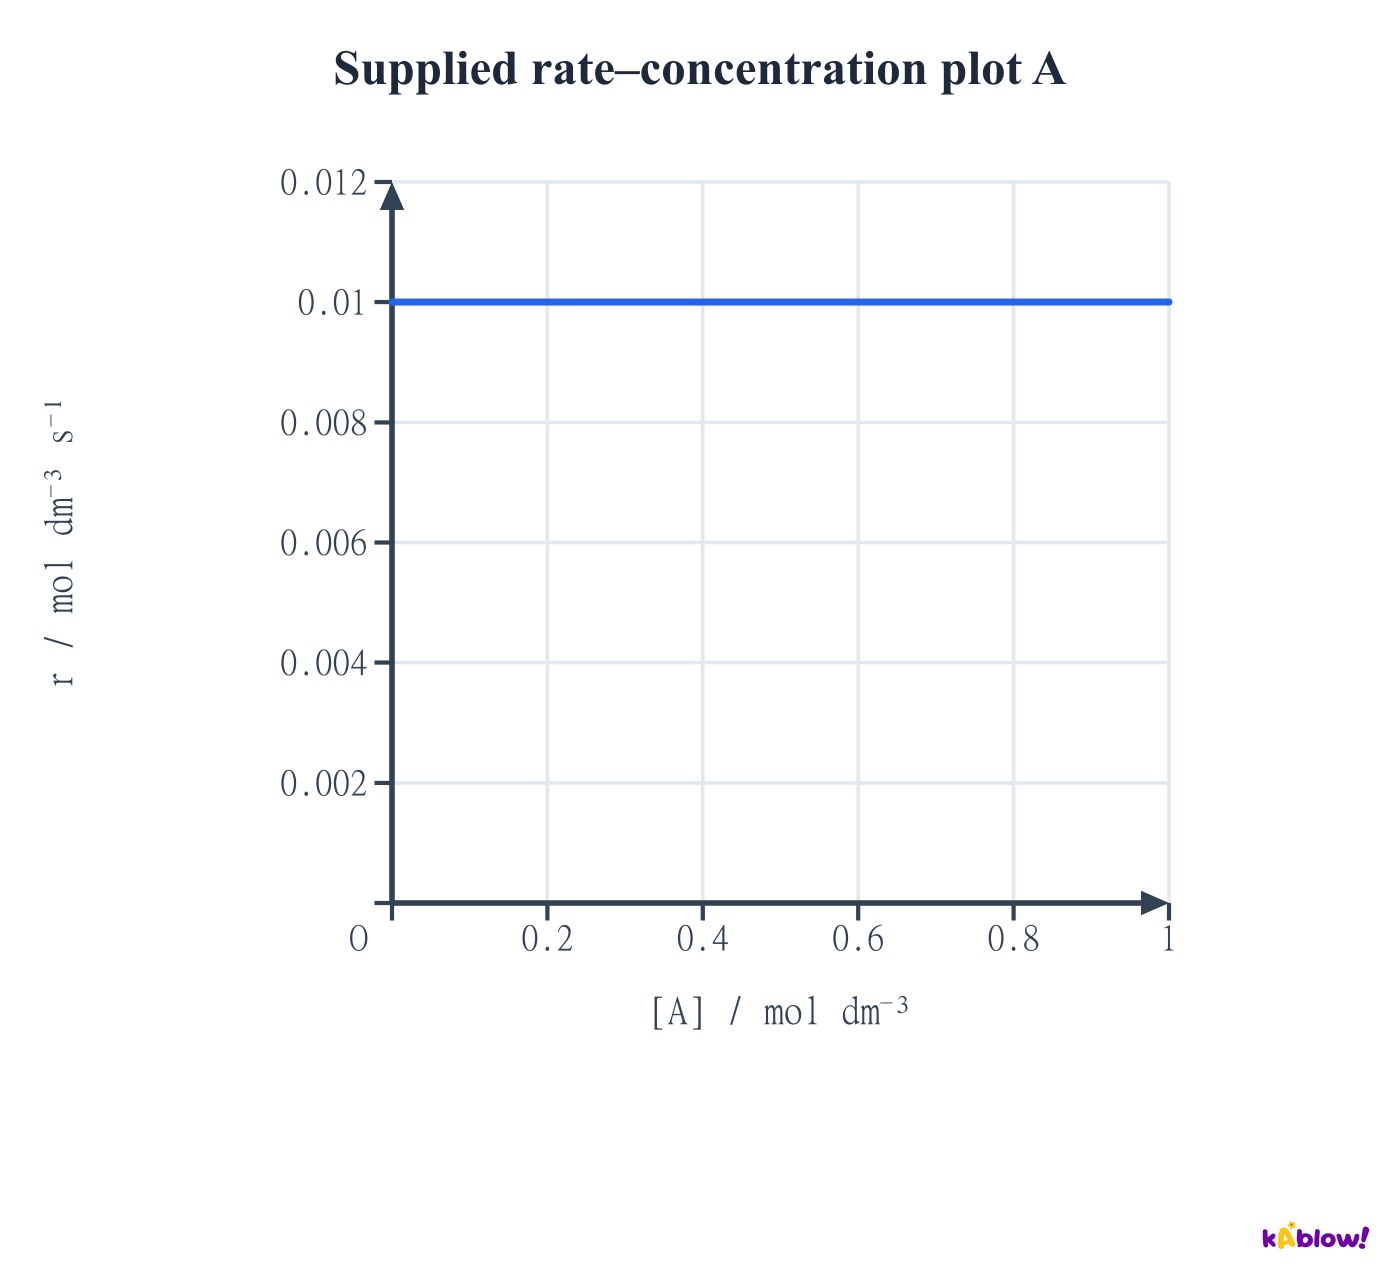
- A horizontal positive rate–concentration line shows that changing the plotted concentration does not change rate over the investigated range.
- The exponent for this species is zero: [A]⁰=1. This does not mean that A is absent from the overall chemical change.
- The model has a finite range. It cannot describe continued consumption after the reactant has run out.
Supplied rate–concentration plot A
Recognise first order from rate versus concentration
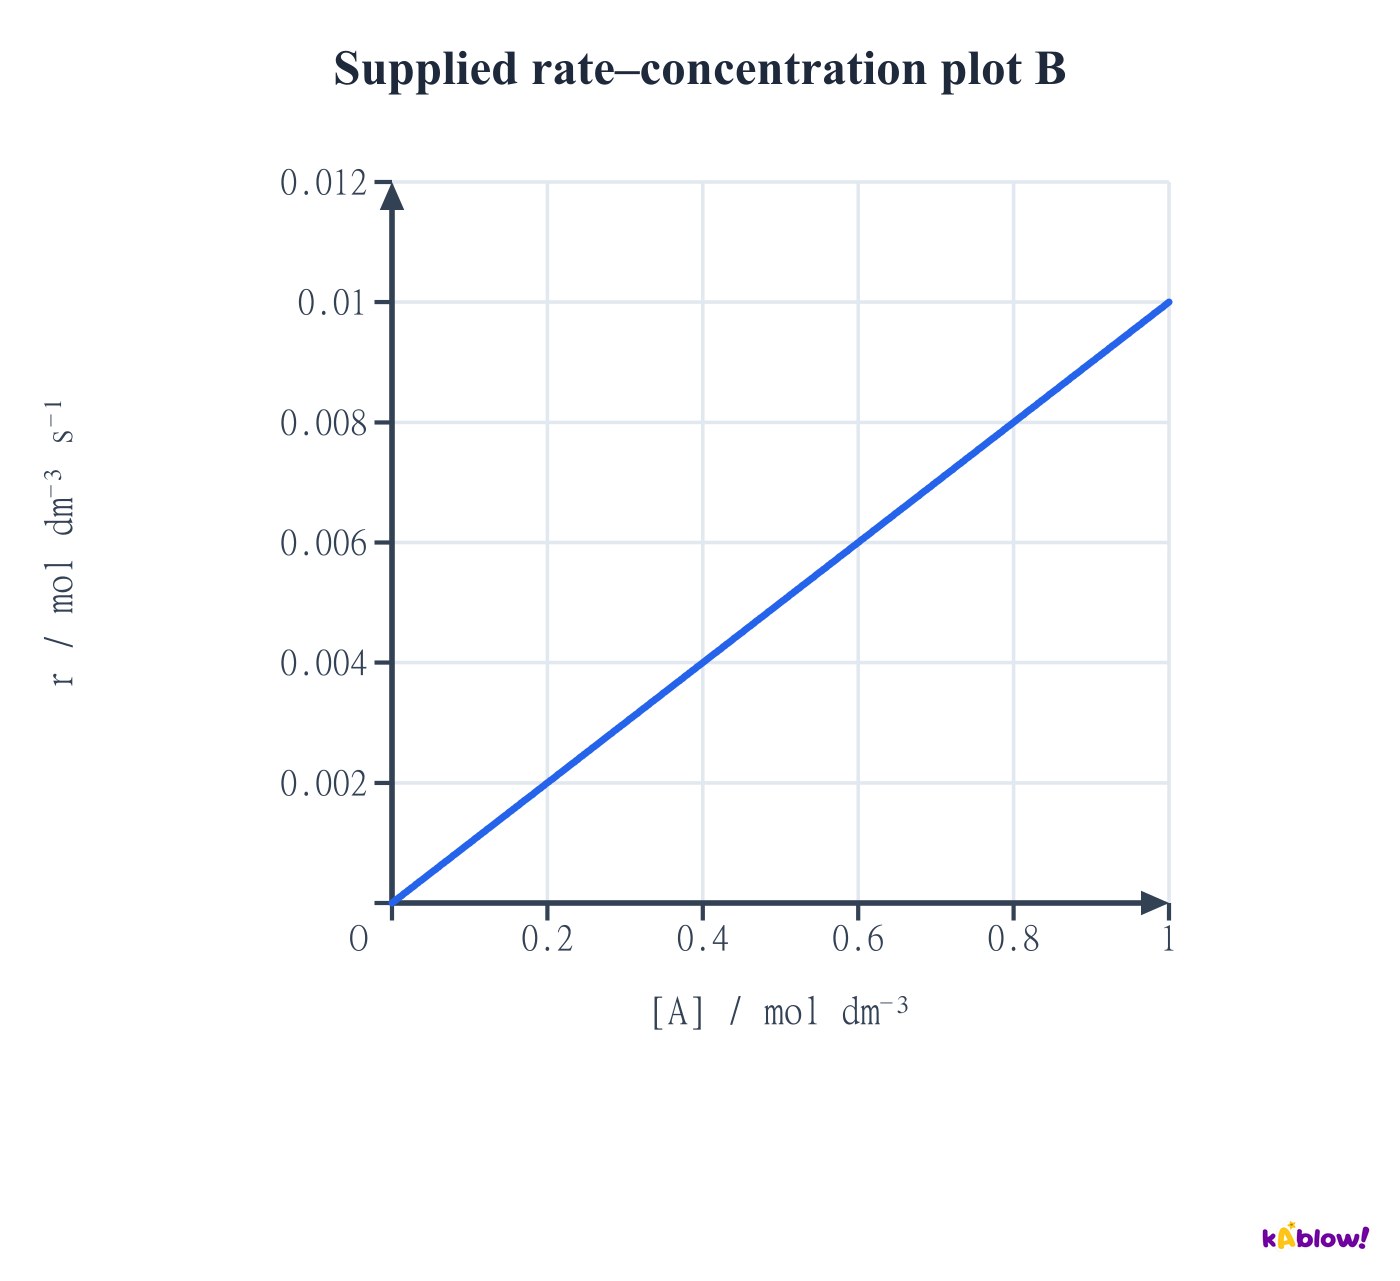
- A straight line through the origin on rate against concentration gives r proportional to[A] when other relevant concentrations and conditions are fixed.
- Doubling[A] doubles rate. The gradient equals the appropriate constant only after accounting for any other fixed concentration factors.
- Do not confuse this with concentration against time: a first-order concentration–time curve is exponential, not a straight line.
Supplied rate–concentration plot B
Recognise second order from rate versus concentration
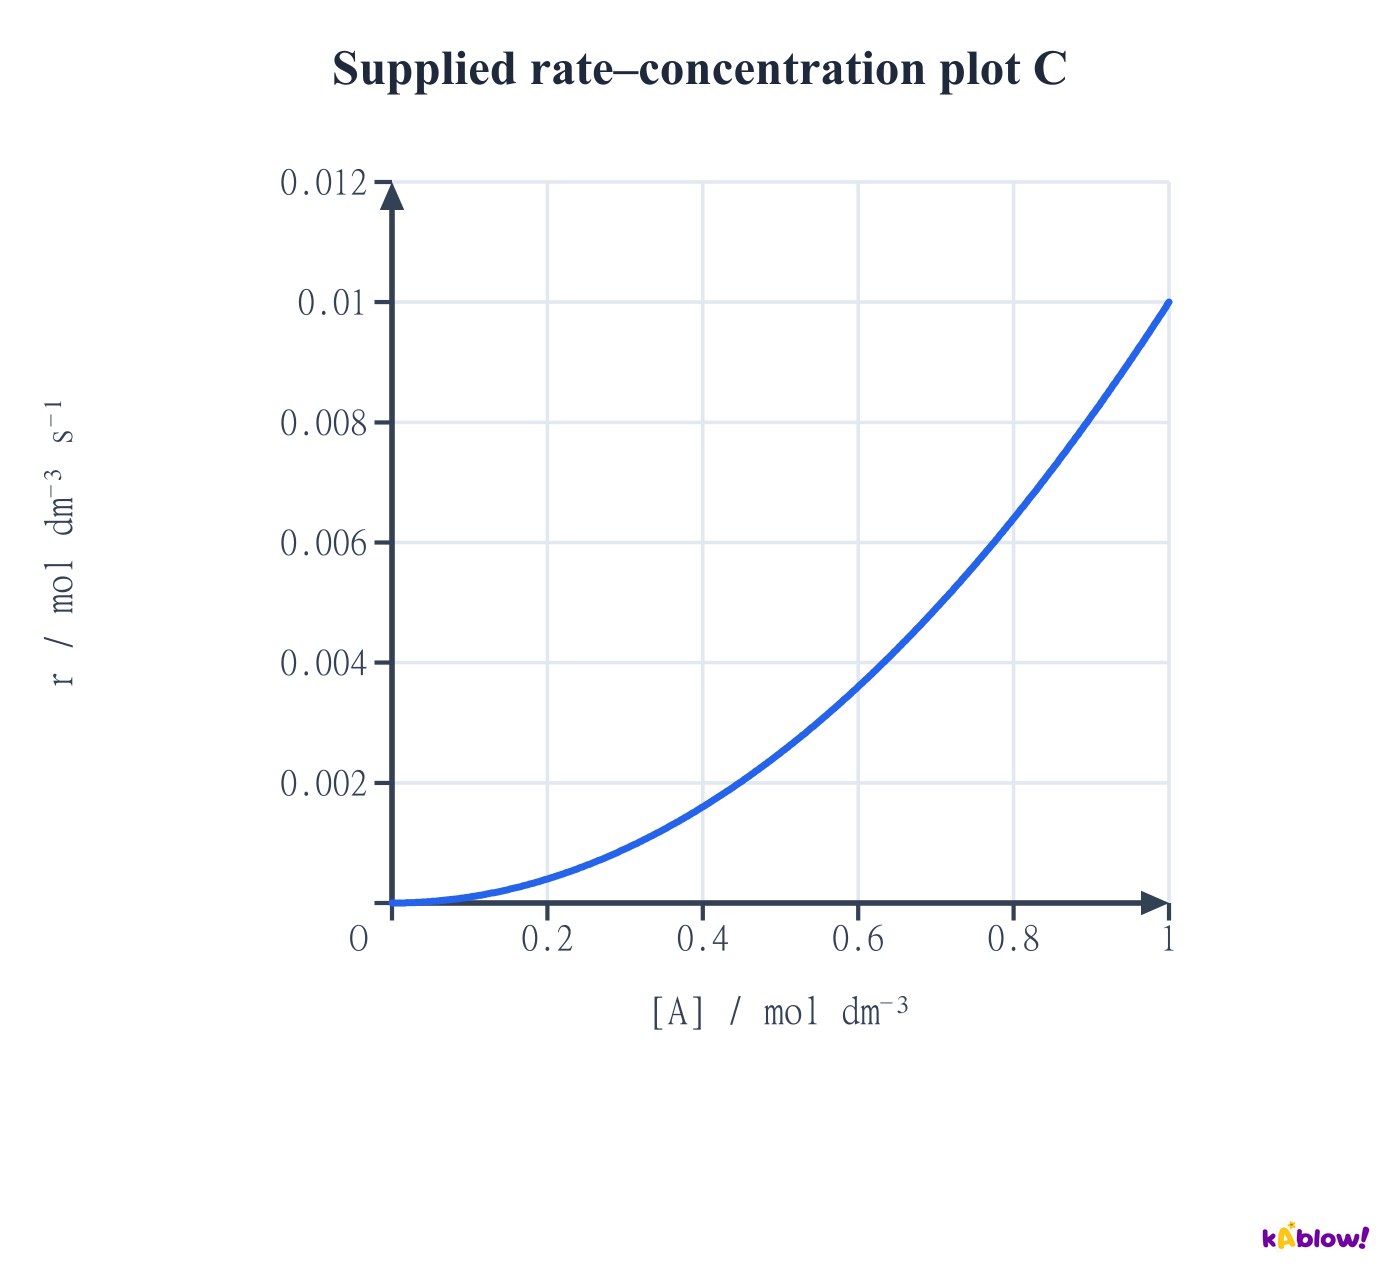
- For r=k[A]² with fixed conditions, rate against[A] is a quadratic curve through the origin. Doubling concentration multiplies rate by four.
- A plot of r against[A]² would be linear through the origin for this model.
- Always inspect both axes. A curved concentration–time trace alone does not establish second order merely because it looks steep.
Supplied rate–concentration plot C
Use controlled initial-rate comparisons
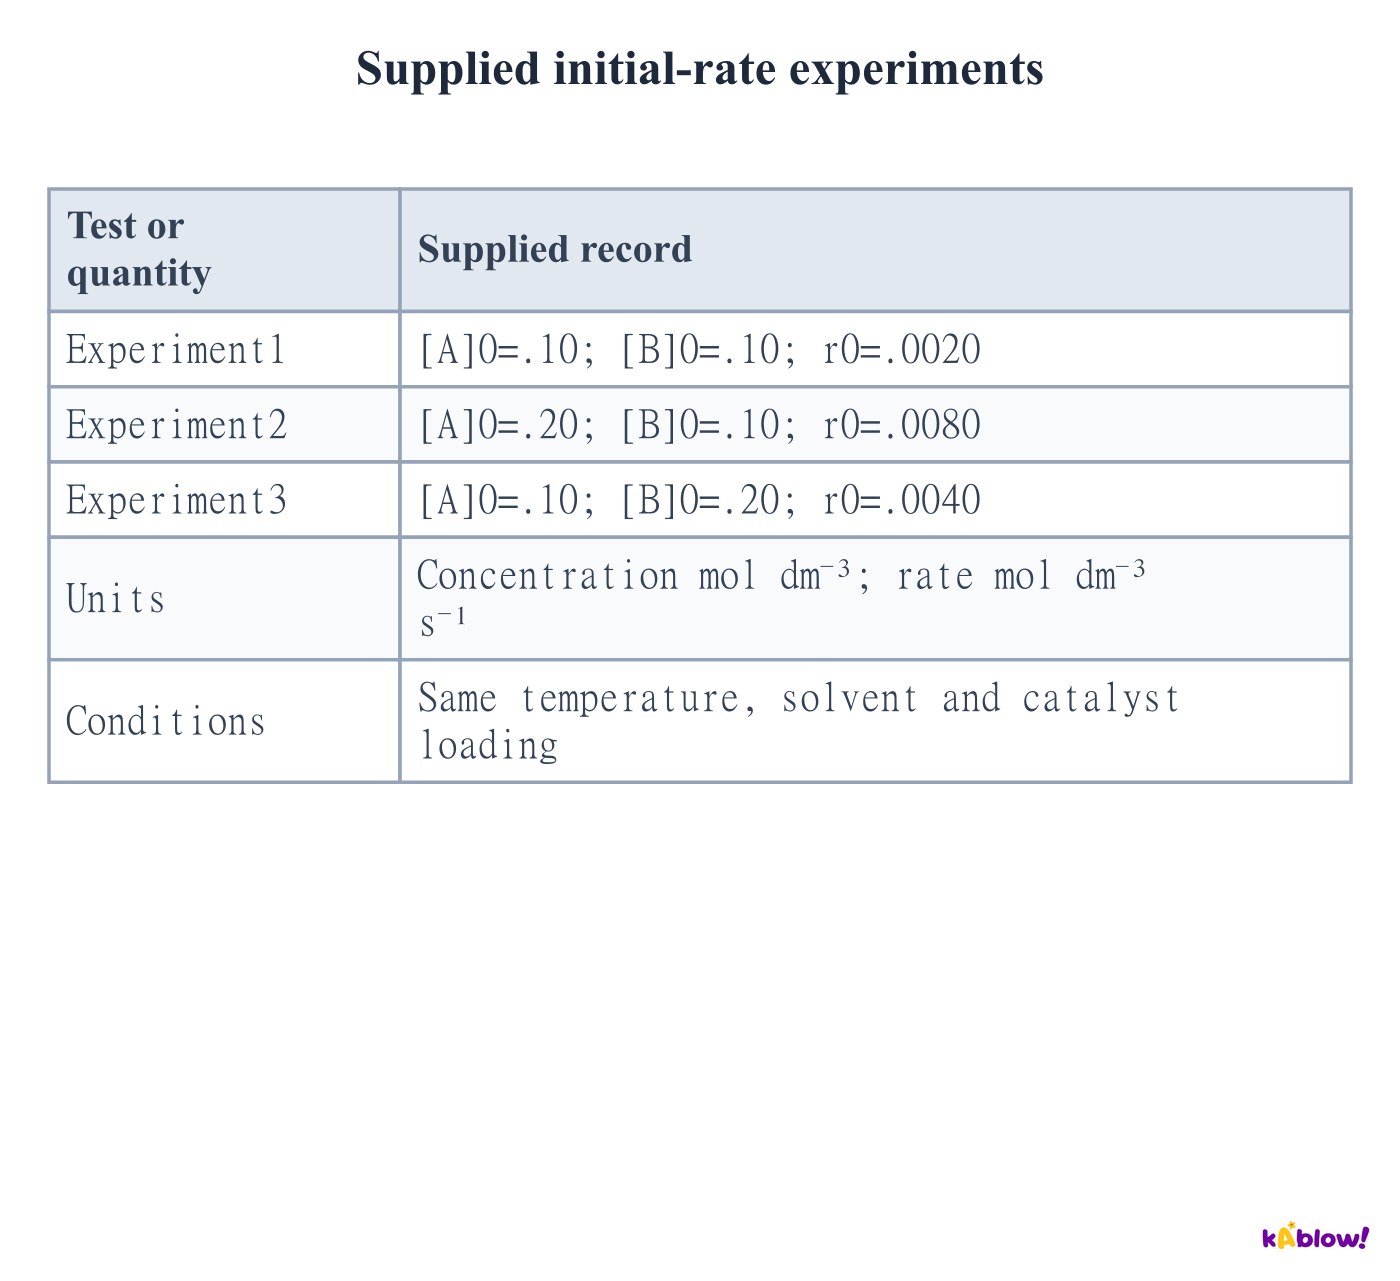
- Compare experiments1 and2: B is fixed while A doubles and rate quadruples. The order in A is two.
- Compare experiments1 and3: A is fixed while B doubles and rate doubles. The order in B is one, giving r=k[A]²[B].
- Temperature, solvent, total-volume effects and catalyst loading must be controlled. Initial concentrations refer to the mixed reaction solution.
Supplied initial-rate experiments
Identify when data cannot separate orders
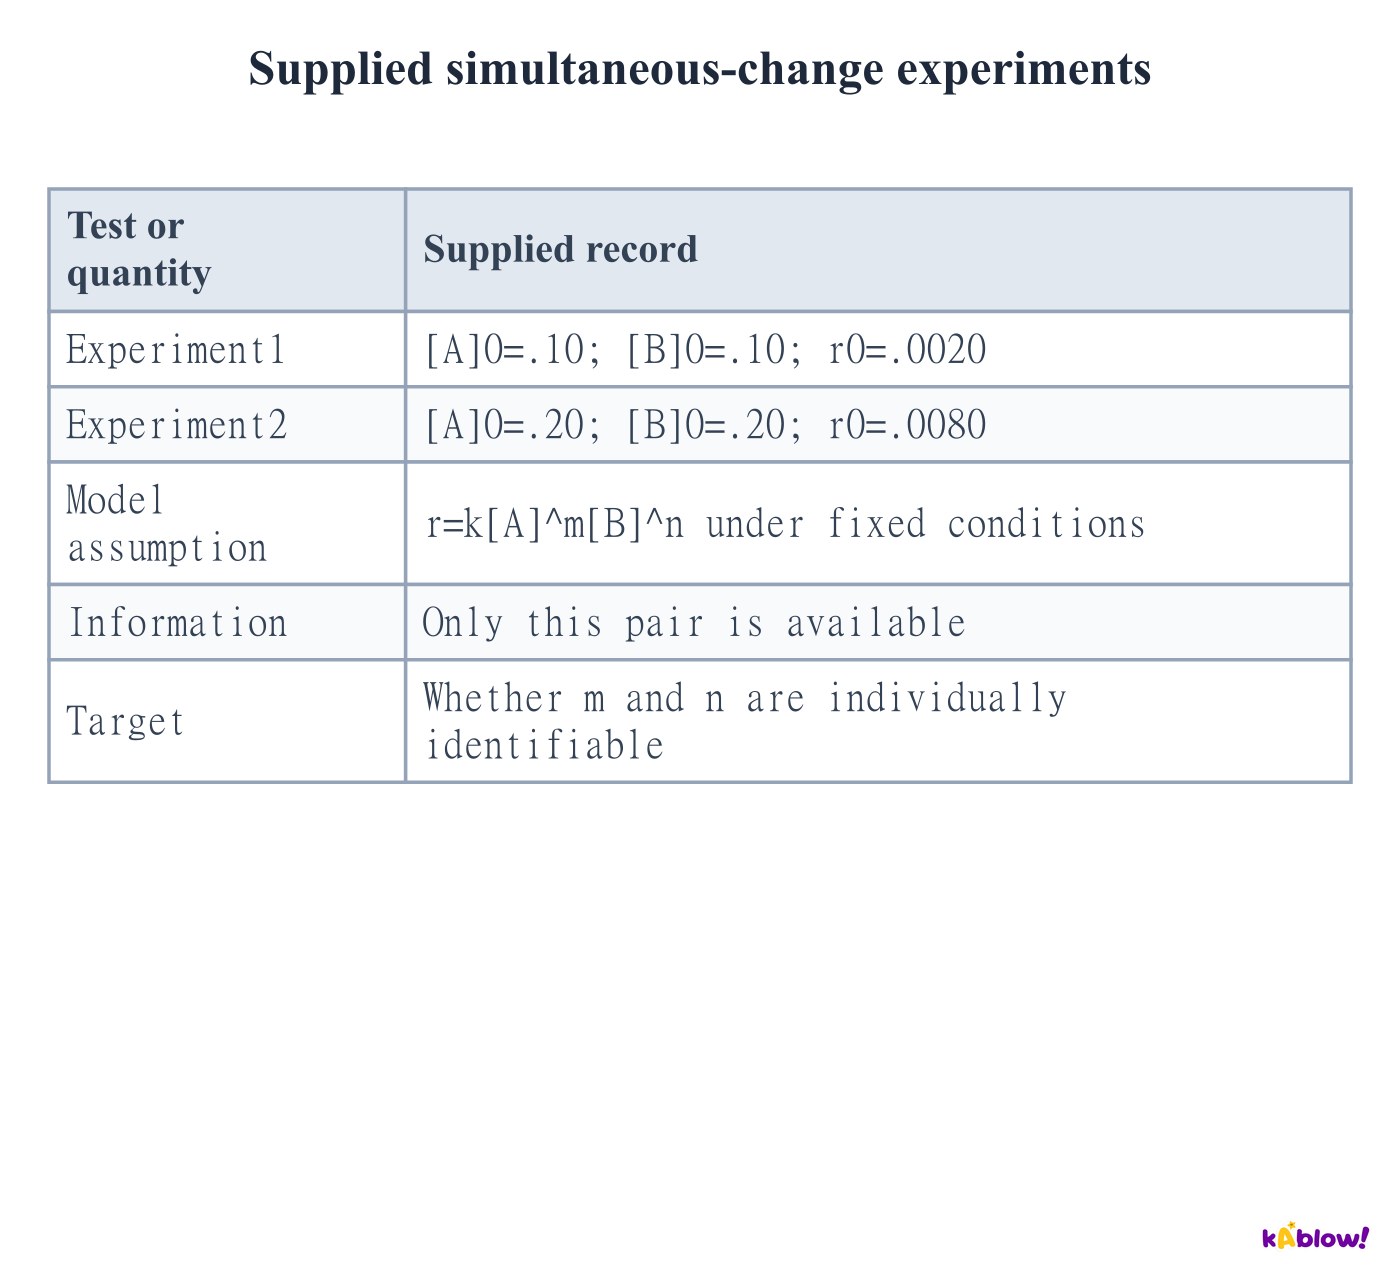
- If A and B both double and rate quadruples, the ratio equation is4=2m×2n. It constrains m+n=2.
- This pair alone cannot distinguish m=2,n=0 from m=1,n=1 or m=0,n=2.
- Simultaneous changes can still be analysed when enough independent experiments are supplied. Seek independent constraints rather than assuming every pair must change only one factor.
Supplied simultaneous-change experiments
Calculate k after determining the orders
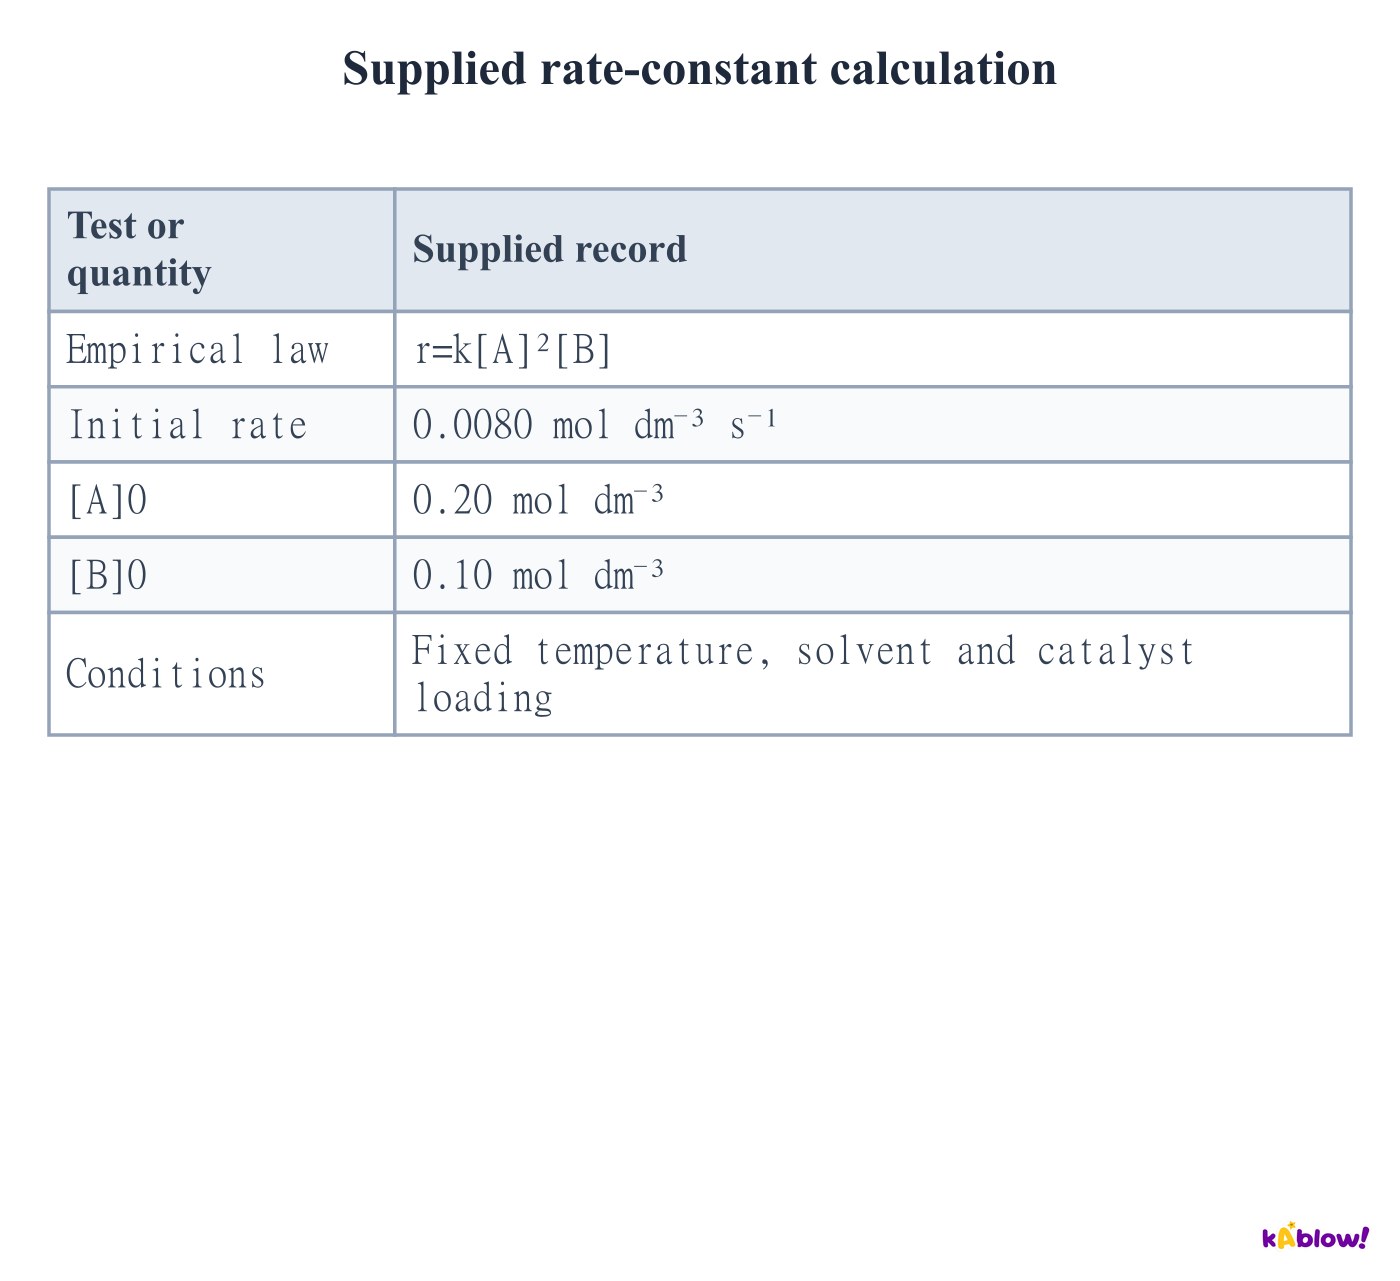
- Rearrange r=k[A]²[B] to k=r/([A]²[B]). Substitute mixed concentrations with consistent units.
- The supplied values give k=0.0080/(0.20²×0.10)=2.0 dm⁶ mol⁻² s⁻¹.
- Changing concentrations alone does not change k under the stated fixed conditions. Temperature, reaction medium or catalyst changes can change its measured value.
Supplied rate-constant calculation
Derive rate-constant units
- Divide rate units by concentration units raised to the overall order. For order n, units are(concentration)^(1−n) time⁻¹.
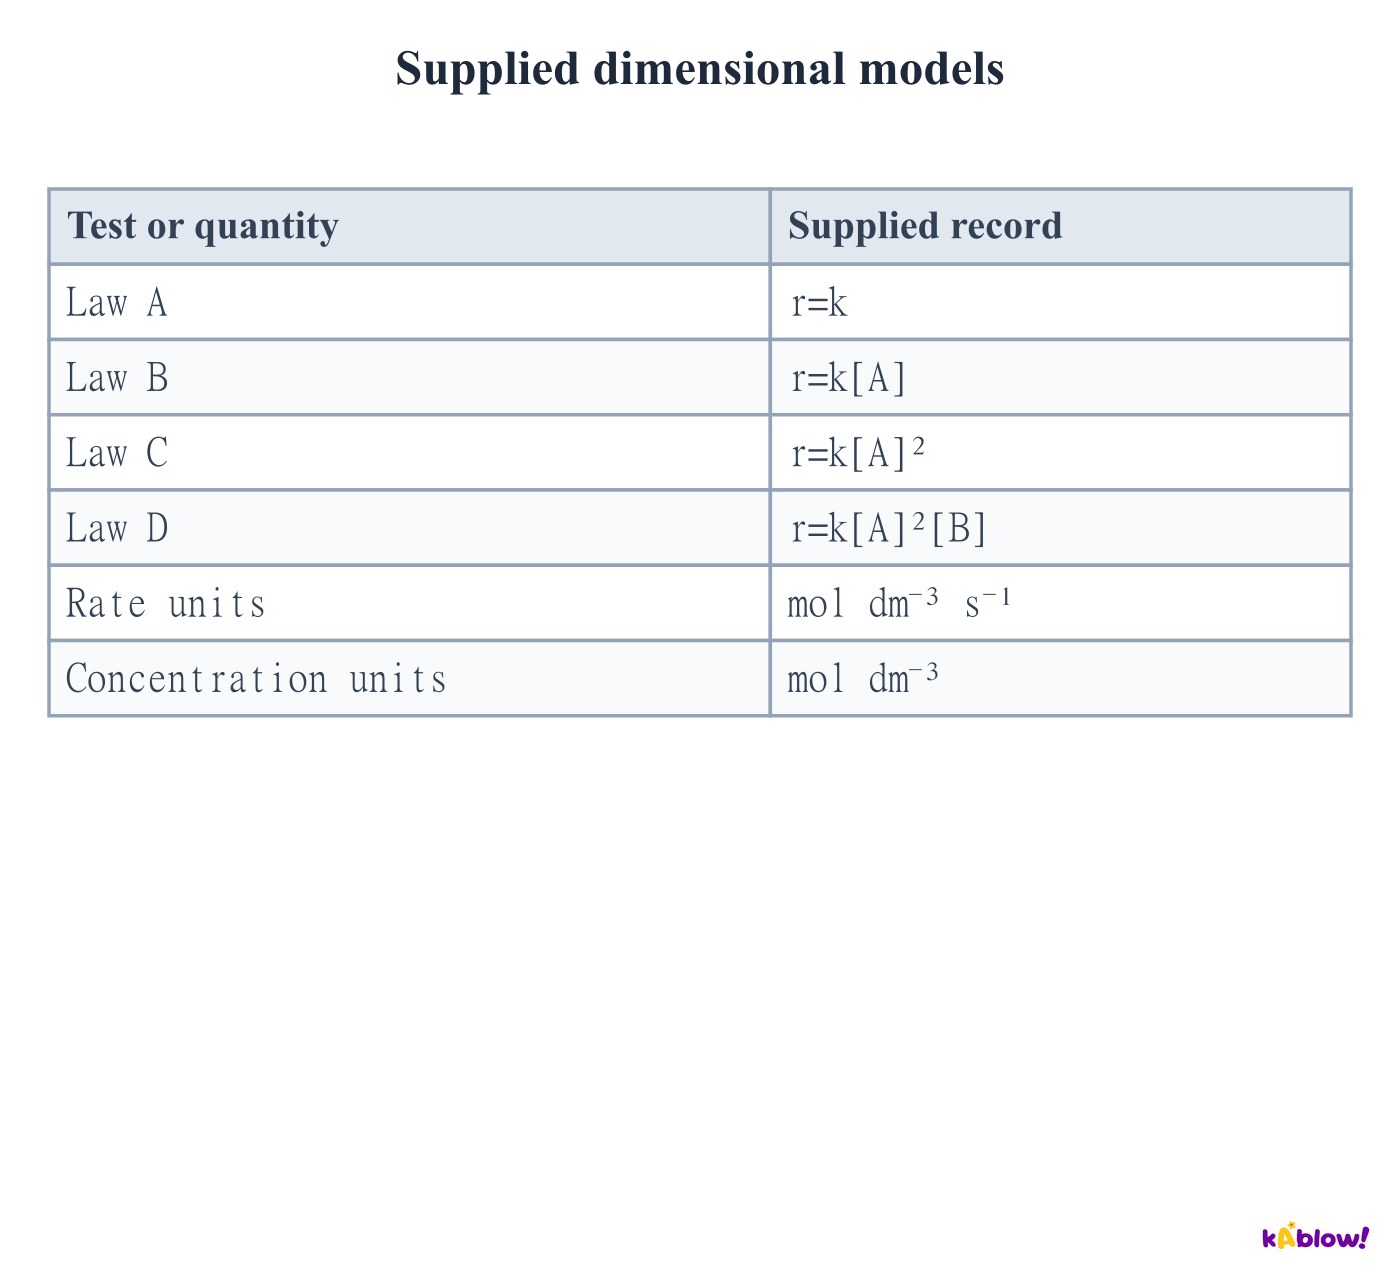
- Zero-order k has mol dm⁻³ s⁻¹; first-order k has s⁻¹; second-order k has dm³ mol⁻¹ s⁻¹.
- Third-order k has dm⁶ mol⁻² s⁻¹. Numerical values change if different concentration or time units are used, so record units with k.
Supplied dimensional models
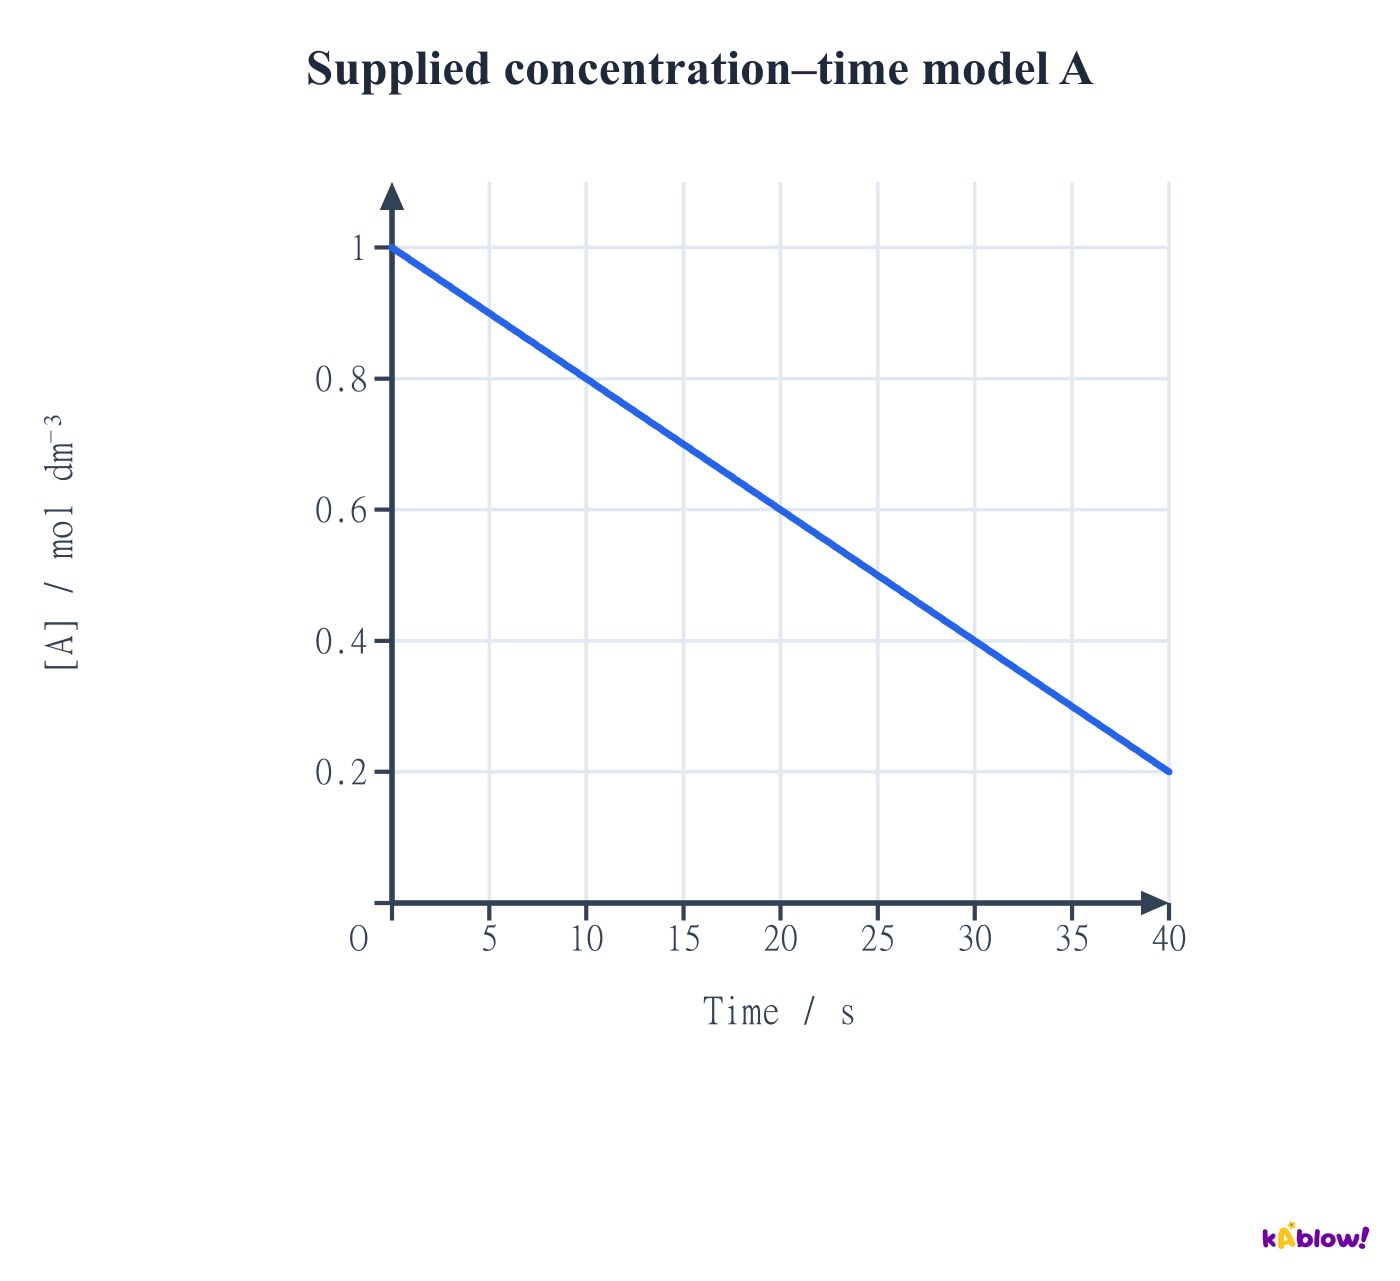
Read a linear concentration–time model
- For the simple disappearance law−d[A]/dt=k, concentration is[A]0−kt while reactant remains. The graph has constant negative gradient.
- Here[A]0=1.0 mol dm⁻³ and k=0.020 mol dm⁻³ s⁻¹. At40 s the concentration is0.20 mol dm⁻³.
- The model predicts depletion at50 s. It must not be extended to negative concentrations, and it is linear rather than inverse proportionality.
Supplied concentration–time model A
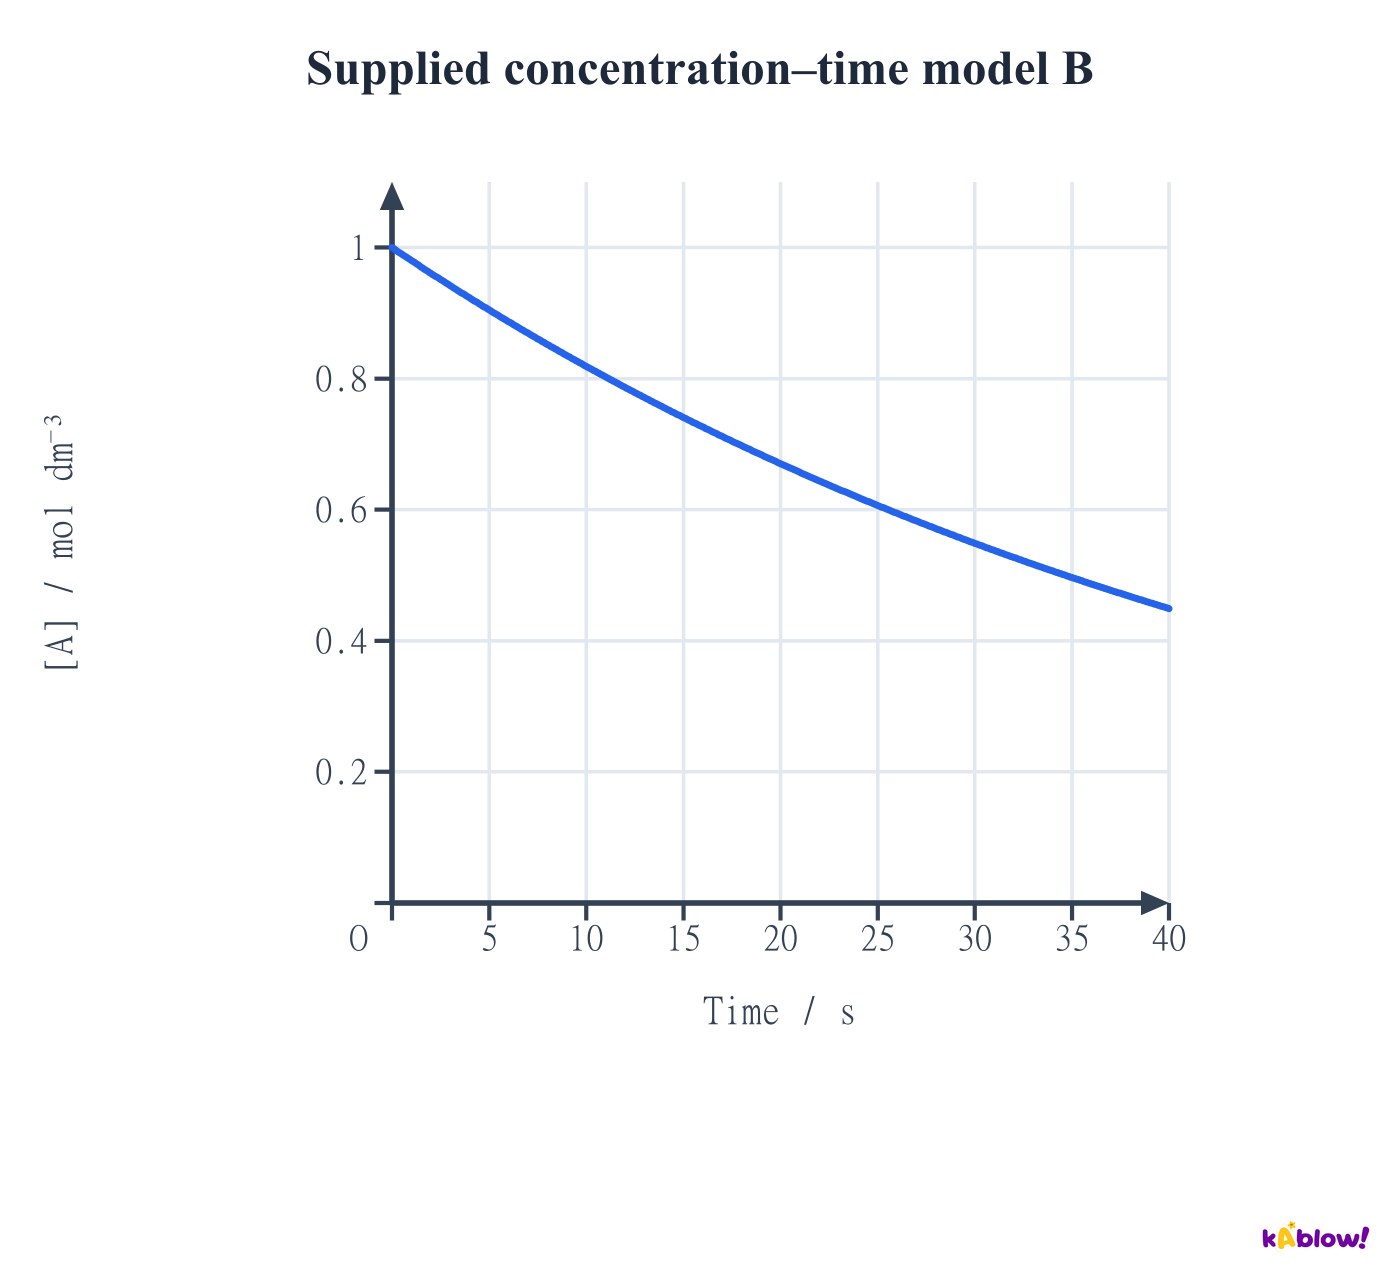
Read an exponential concentration–time model
- For−d[A]/dt=k[A], the simple one-reactant model gives[A]=[A]0 exp(−kt). The negative gradient becomes smaller in magnitude as A decreases.
- The supplied curve uses k=0.020 s⁻¹ and[A]0=1.0 mol dm⁻³. Its initial disappearance rate is0.020 mol dm⁻³ s⁻¹.
- Extension: successive concentration halvings take equal times in this model, t½=ln2/k. This is a model-specific diagnostic, not a universal property of reactions.
Supplied concentration–time model B
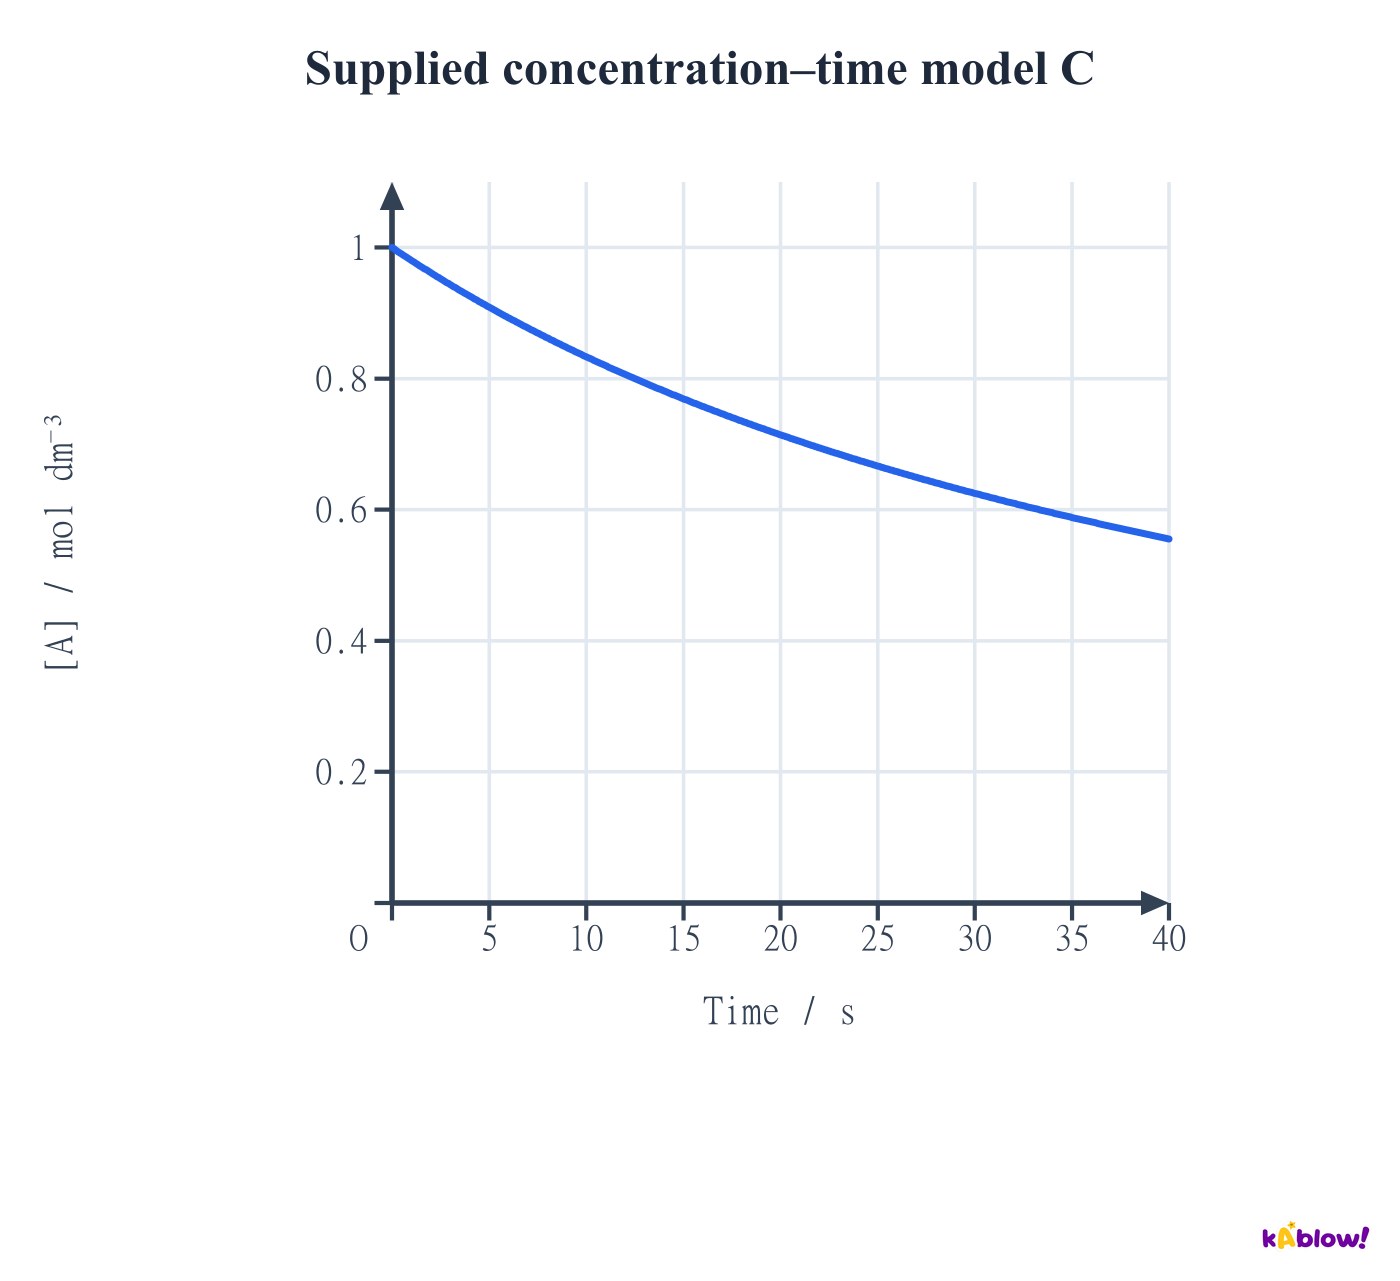
Compare concentration–time models fairly
- The simple second-order model−d[A]/dt=k[A]² gives[A]=[A]0/(1+k[A]0t). Here k=0.020 dm³ mol⁻¹ s⁻¹ and[A]0=1.0 mol dm⁻³.
- The supplied three time models share the same initial concentration and initial disappearance rate, while k has different units in each.
- Do not identify order from absolute steepness: initial concentrations, k and plot scales affect it. Use quantitative model tests or controlled rate–concentration data.
Supplied concentration–time model C
Find an initial rate from a tangent
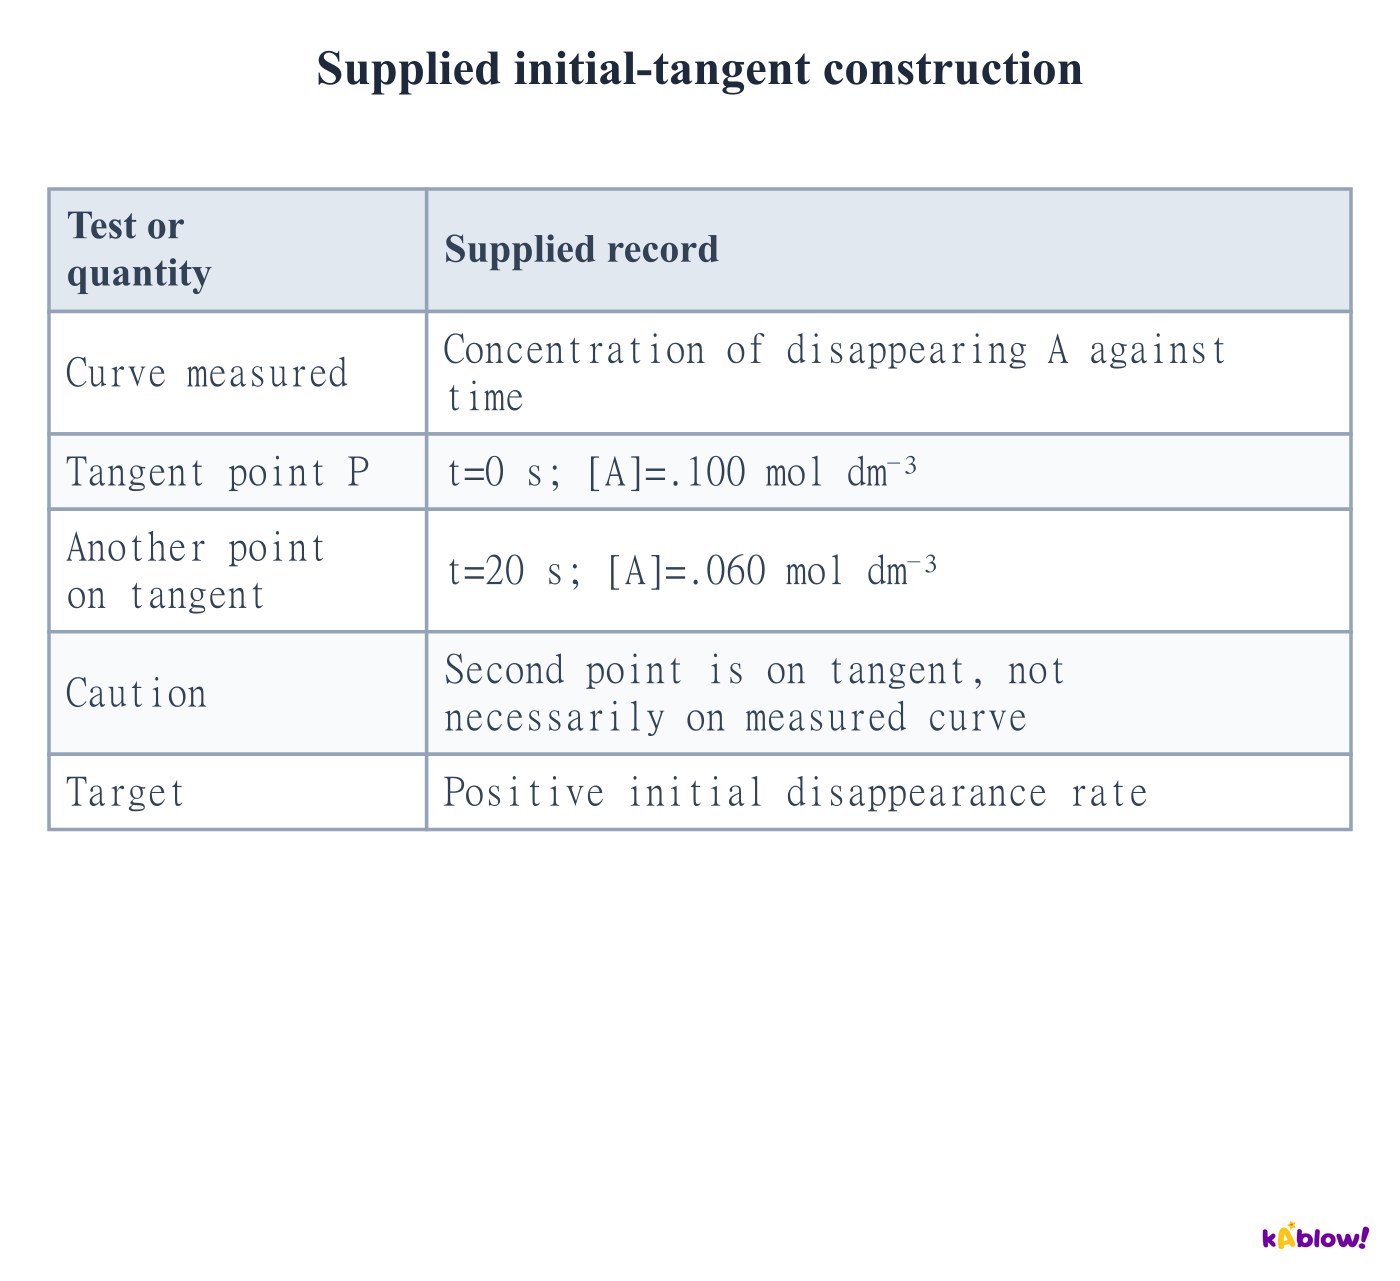
- Draw a tangent to the measured concentration–time curve at t=0. Use widely separated readable points on that tangent to estimate its gradient.
- The supplied tangent slope is(0.060−0.100)/(20−0)=−0.0020 mol dm⁻³ s⁻¹, so the positive disappearance rate is0.0020 mol dm⁻³ s⁻¹.
- A secant over a finite reaction interval gives an average rate. Mixing delay and early measurement uncertainty affect an initial tangent estimate.
Supplied initial-tangent construction
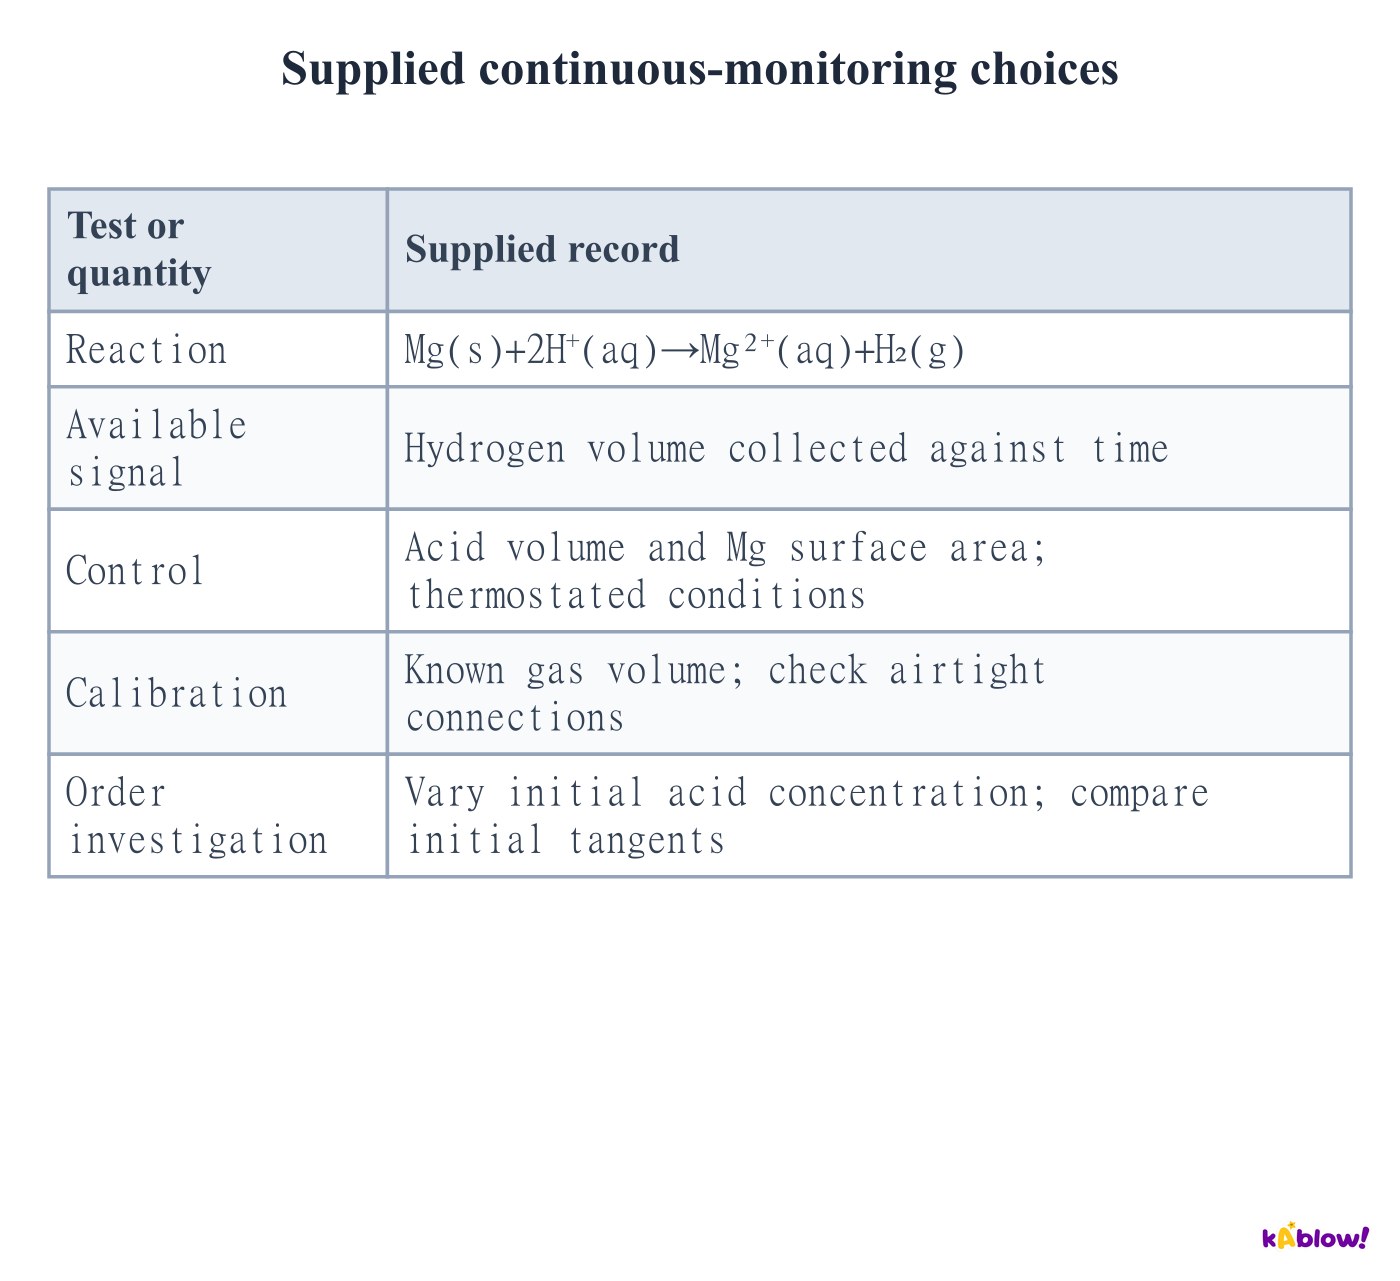
Plan continuous monitoring for required practical7
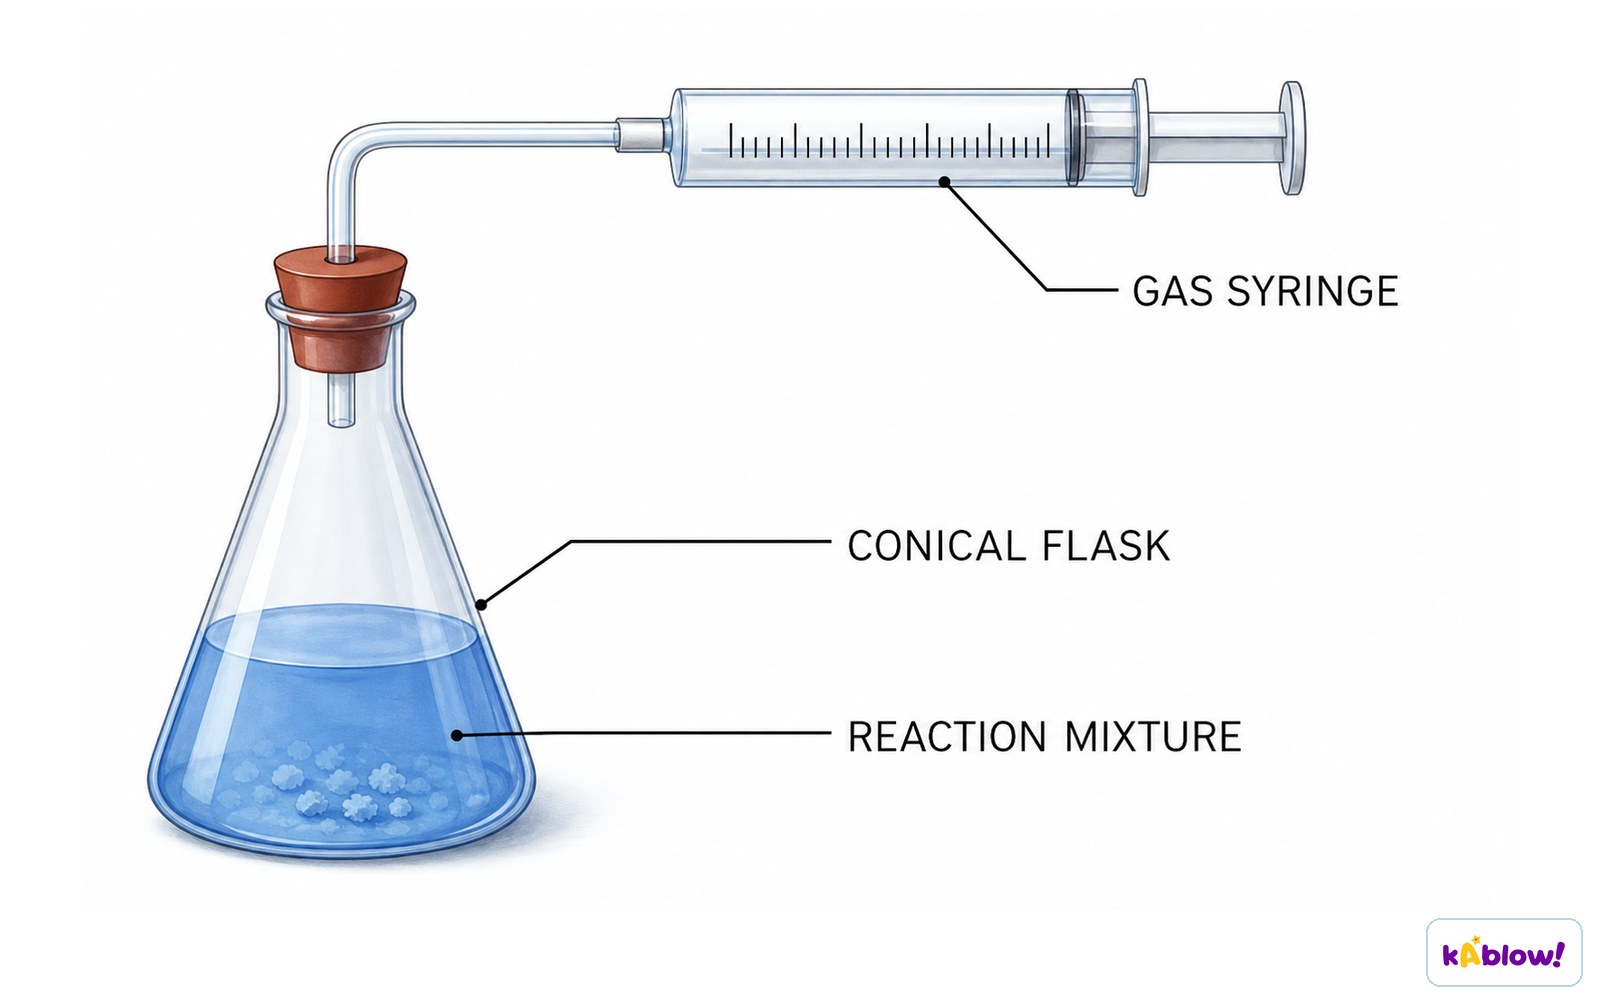
- Choose a signal that tracks reaction progress, such as gas volume, mass loss, colour or concentration. Relate signal change to the species or reaction rate being reported.
- For Mg and acid, an airtight gas syringe can monitor hydrogen formation. Compare initial tangents across measured initial acid concentrations.
- Keep magnesium surface area, acid volume and temperature controlled. Check gas leaks, syringe friction, mixing and timing; follow the practical risk assessment for acid and flammable hydrogen.
Record gas volume over time
Use a small fixed clock endpoint
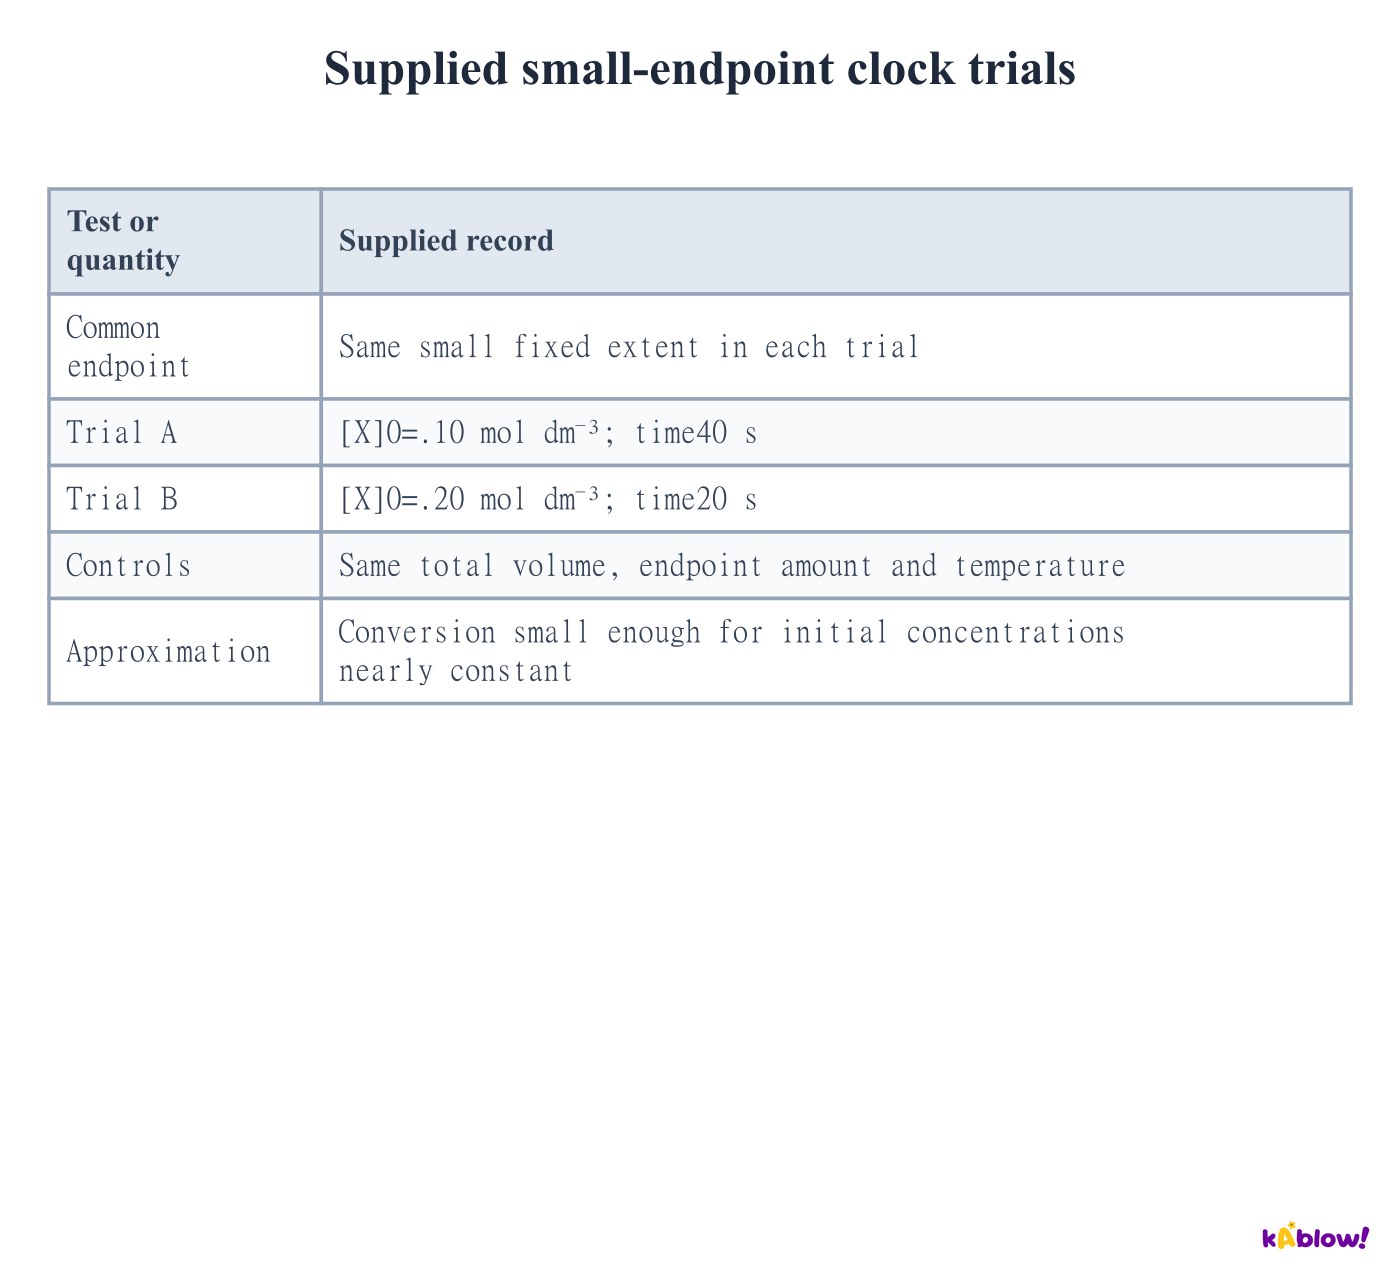
- A clock measures the time to a known small extent. With the same endpoint amount and total volume, rate is approximately proportional to1/t when initial concentrations change little.
- The supplied doubling of X halves time, so its initial-rate proxy doubles. This supports first order in X under the stated approximation and controls.
- 1/t has units s⁻¹ and is a proxy, not automatically a concentration rate. Multiply the known endpoint concentration change by1/t when an absolute rate is required.
Supplied small-endpoint clock trials
Separate repeatability from accuracy
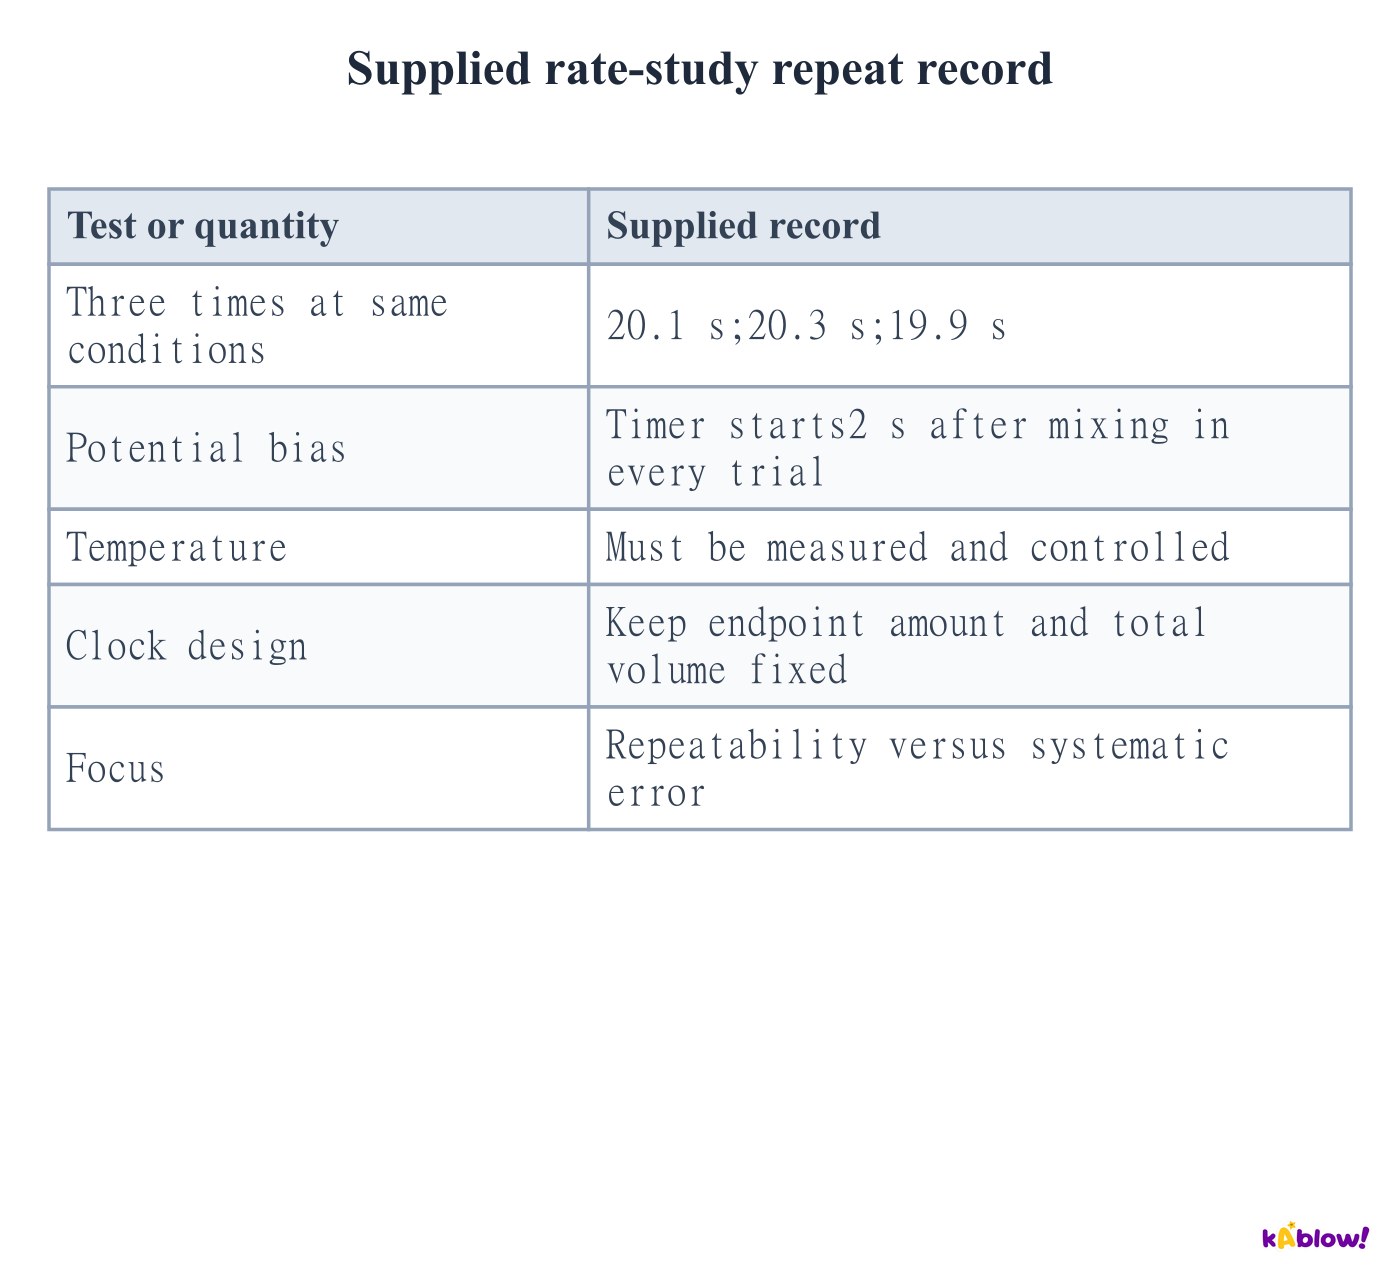
- Closely agreeing repeat times indicate repeatability. A common mixing or timing delay can still bias every result.
- Repeat experiments, identify anomalous trials, calculate a justified mean and report measurement uncertainty. Do not assume a mean removes systematic error.
- Control temperature, mixed volumes and endpoint amount. Use the same timing convention and improve rapid mixing or automatic detection where appropriate.
Supplied rate-study repeat record
Use the Arrhenius equation with consistent units
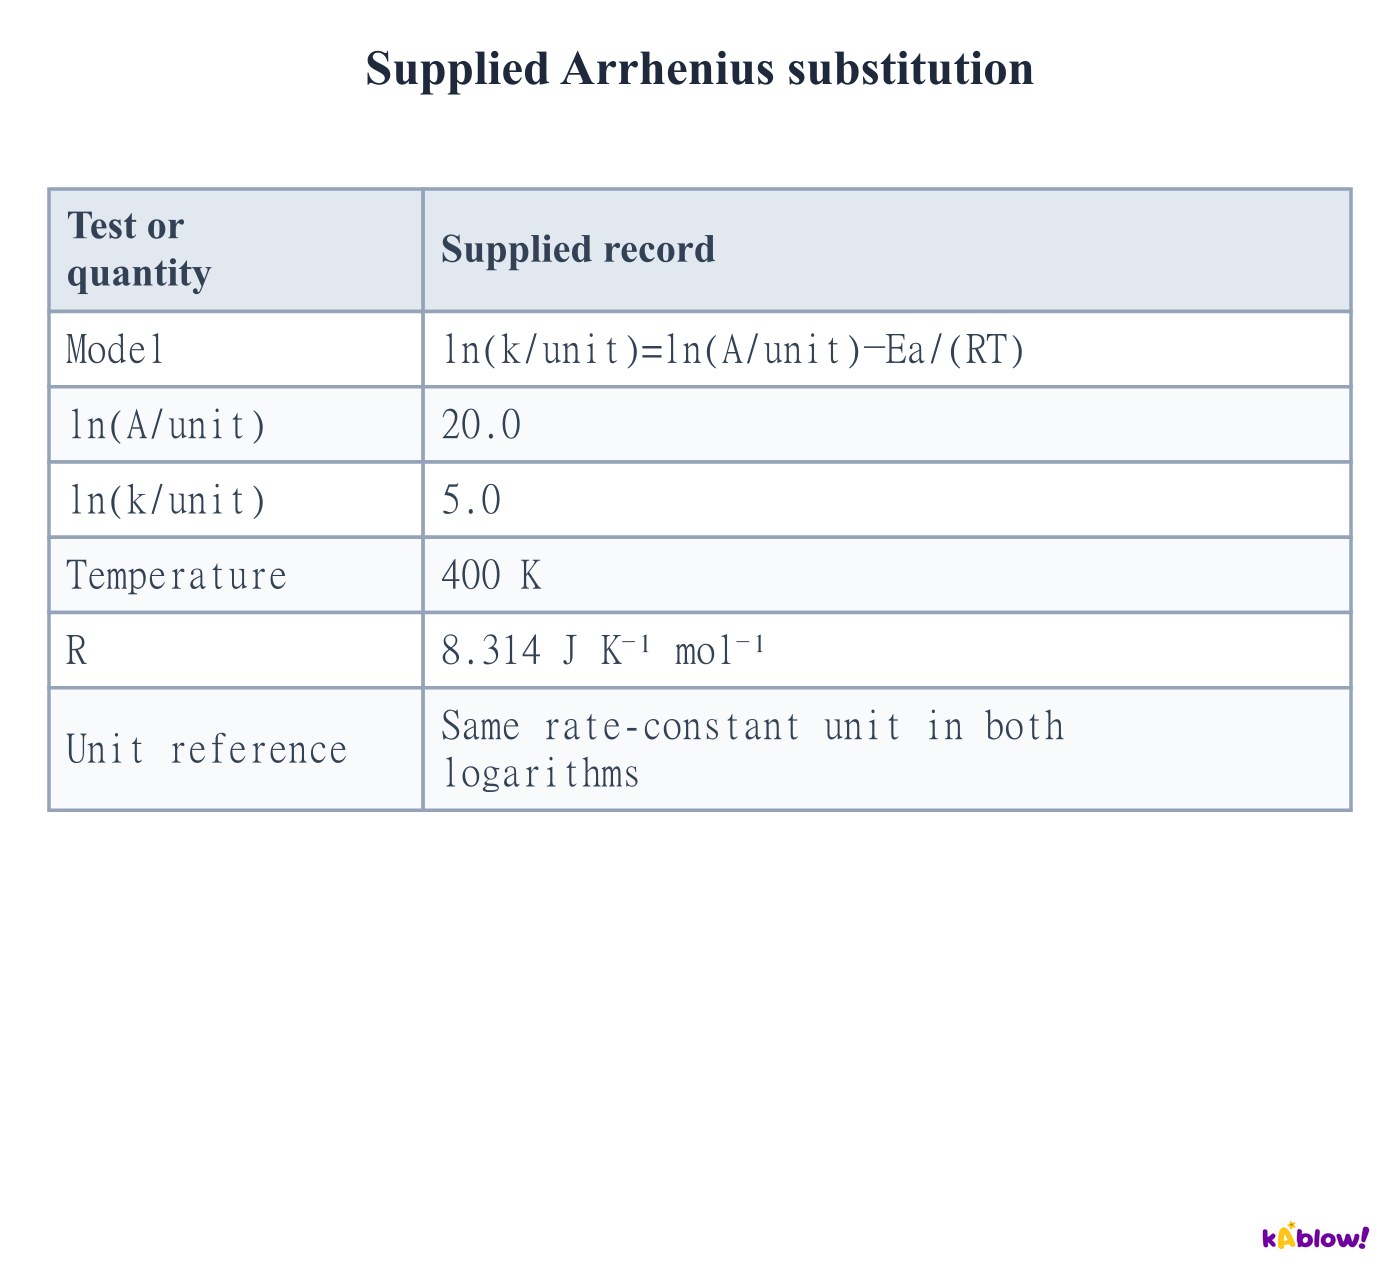
- Use k=A exp(−Ea/RT), or ln(k/unit)=ln(A/unit)−Ea/(RT). A and k have the same units; both logarithms use the same reference unit.
- Use thermodynamic temperature in kelvin. With R=8.314 J K⁻¹ mol⁻¹, Ea must be in J mol⁻¹ before conversion to kJ mol⁻¹.
- The supplied difference20−5=15 gives Ea=15×8.314×400=49884 J mol⁻¹, or49.9 kJ mol⁻¹ to three significant figures. The model assumes A and Ea apply over its investigated range.
Supplied Arrhenius substitution
Extract activation energy from an Arrhenius plot
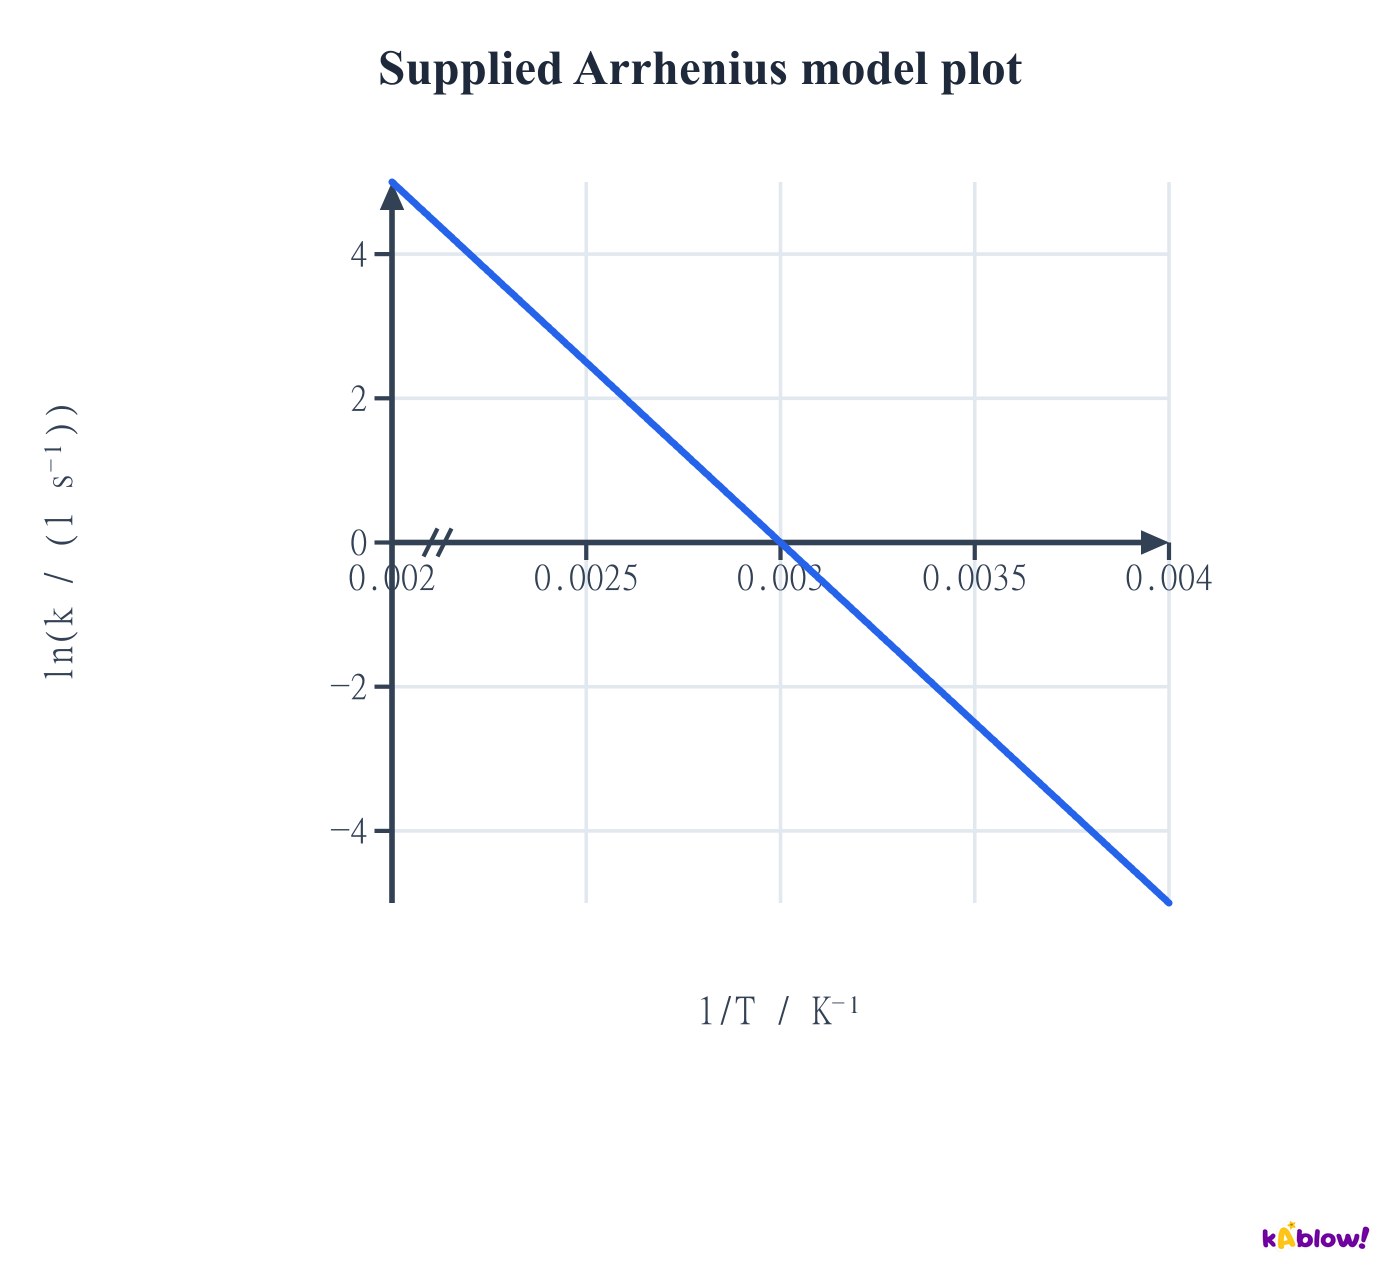
- Plot ln(k/unit) vertically against1/T horizontally. The gradient is−Ea/R, and the extrapolated vertical intercept is ln(A/unit).
- The supplied unscaled reciprocal-temperature line has gradient−5000 K. Ea=5000×8.314=41570 J mol⁻¹=41.57 kJ mol⁻¹.
- For positive Ea, the line falls as1/T rises. Higher temperature lies to the left. Do not interpret an extrapolated intercept as a measured infinite-temperature result.
Supplied Arrhenius model plot
Compare rate constants at two temperatures
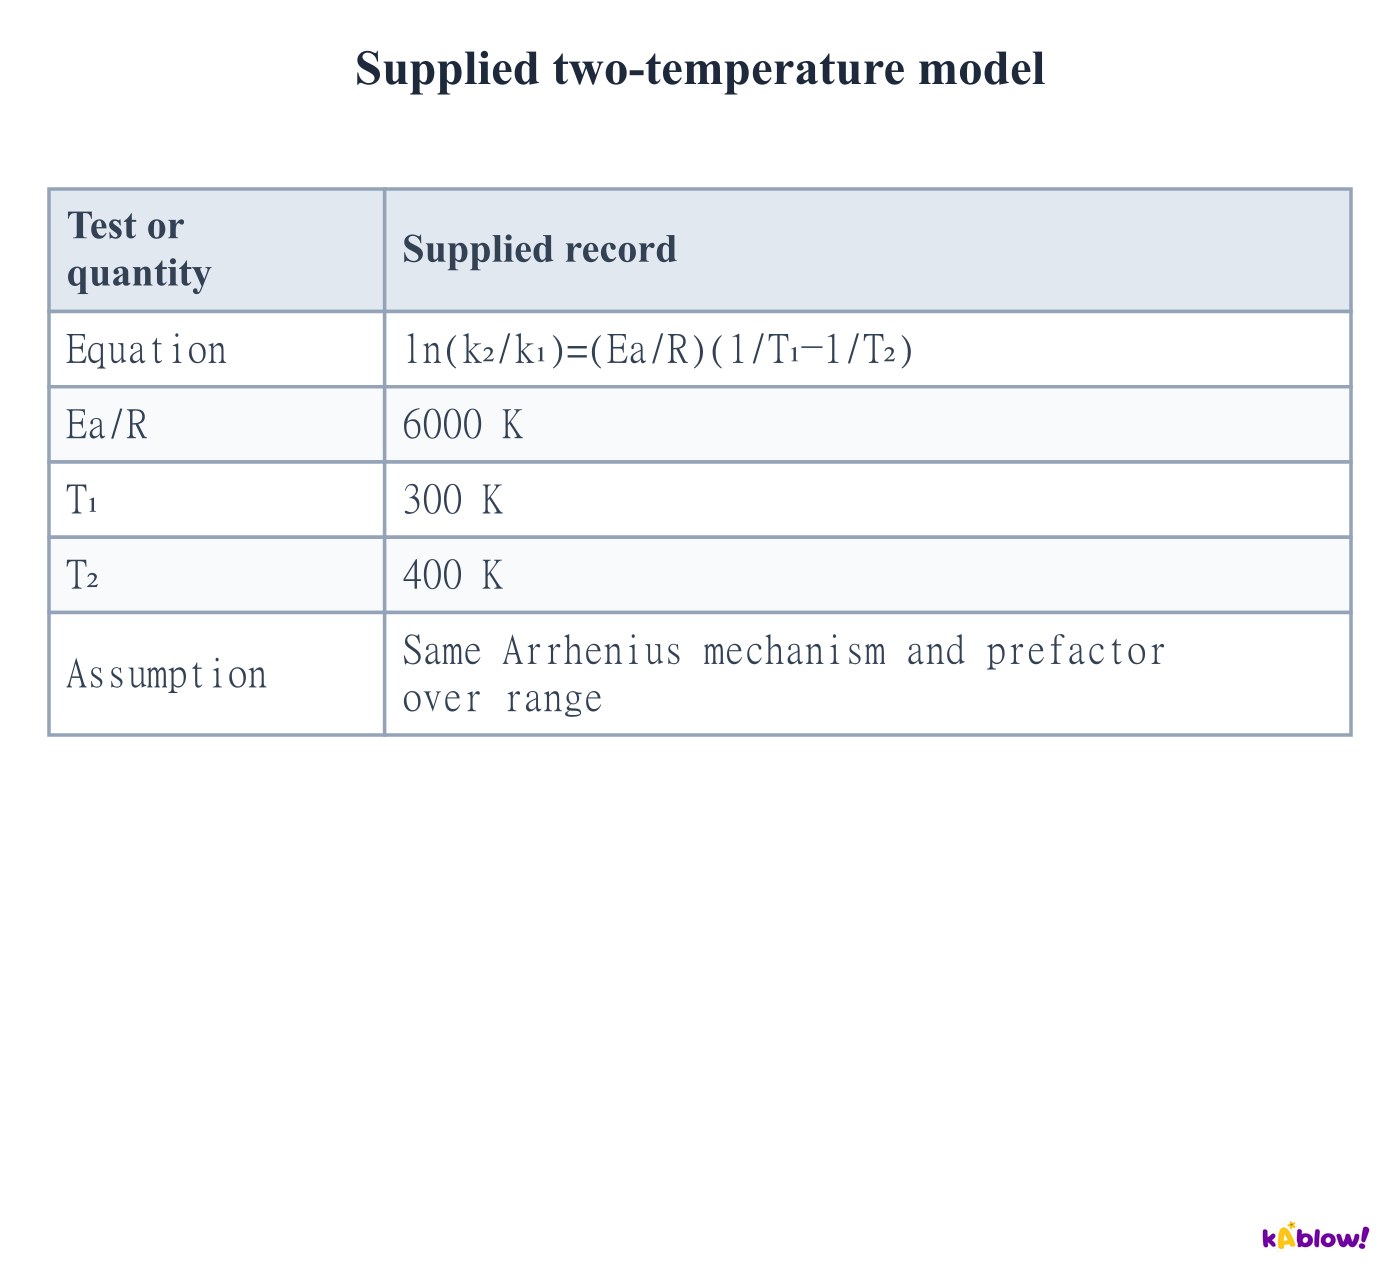
- Subtract the two Arrhenius equations to eliminate a common prefactor: ln(k₂/k₁)=(Ea/R)(1/T₁−1/T₂).
- For the supplied300 K and400 K data, the logarithmic ratio is6000×(1/300−1/400)=5. Thus k₂/k₁=e⁵, approximately148.
- This comparison assumes the same mechanism and effective Arrhenius parameters over the range. A higher k need not guarantee the same measured rate if concentrations or other conditions also change.
Supplied two-temperature model
Check reciprocal-temperature axis scaling
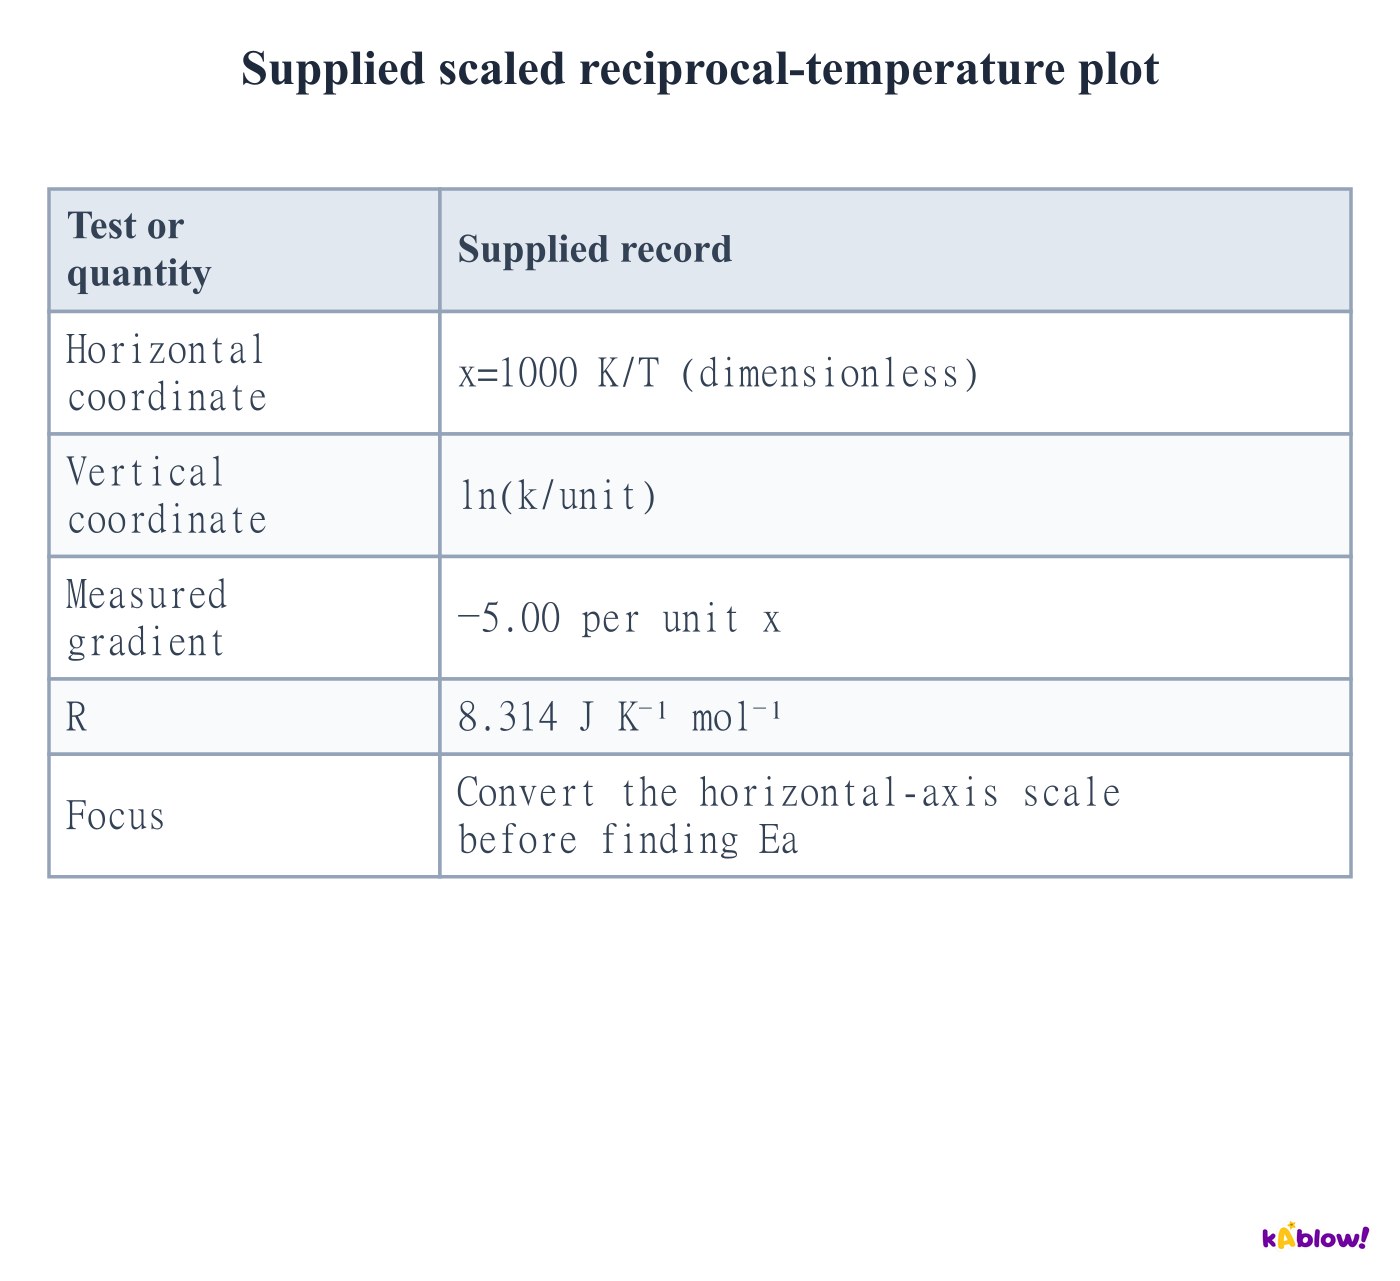
- If x=1000 K/T, then1/T=x/(1000 K). The Arrhenius gradient against x is−Ea/(1000 K×R).
- A supplied gradient−5.00 therefore gives Ea=5.00×1000×8.314=41570 J mol⁻¹, not41.57 J mol⁻¹.
- Read axis factors and units before substitution. A graph of log10(k/unit) would require an additional ln10 factor; the standard AQA form uses natural logarithms.
Supplied scaled reciprocal-temperature plot
Test an elementary slow-step proposal
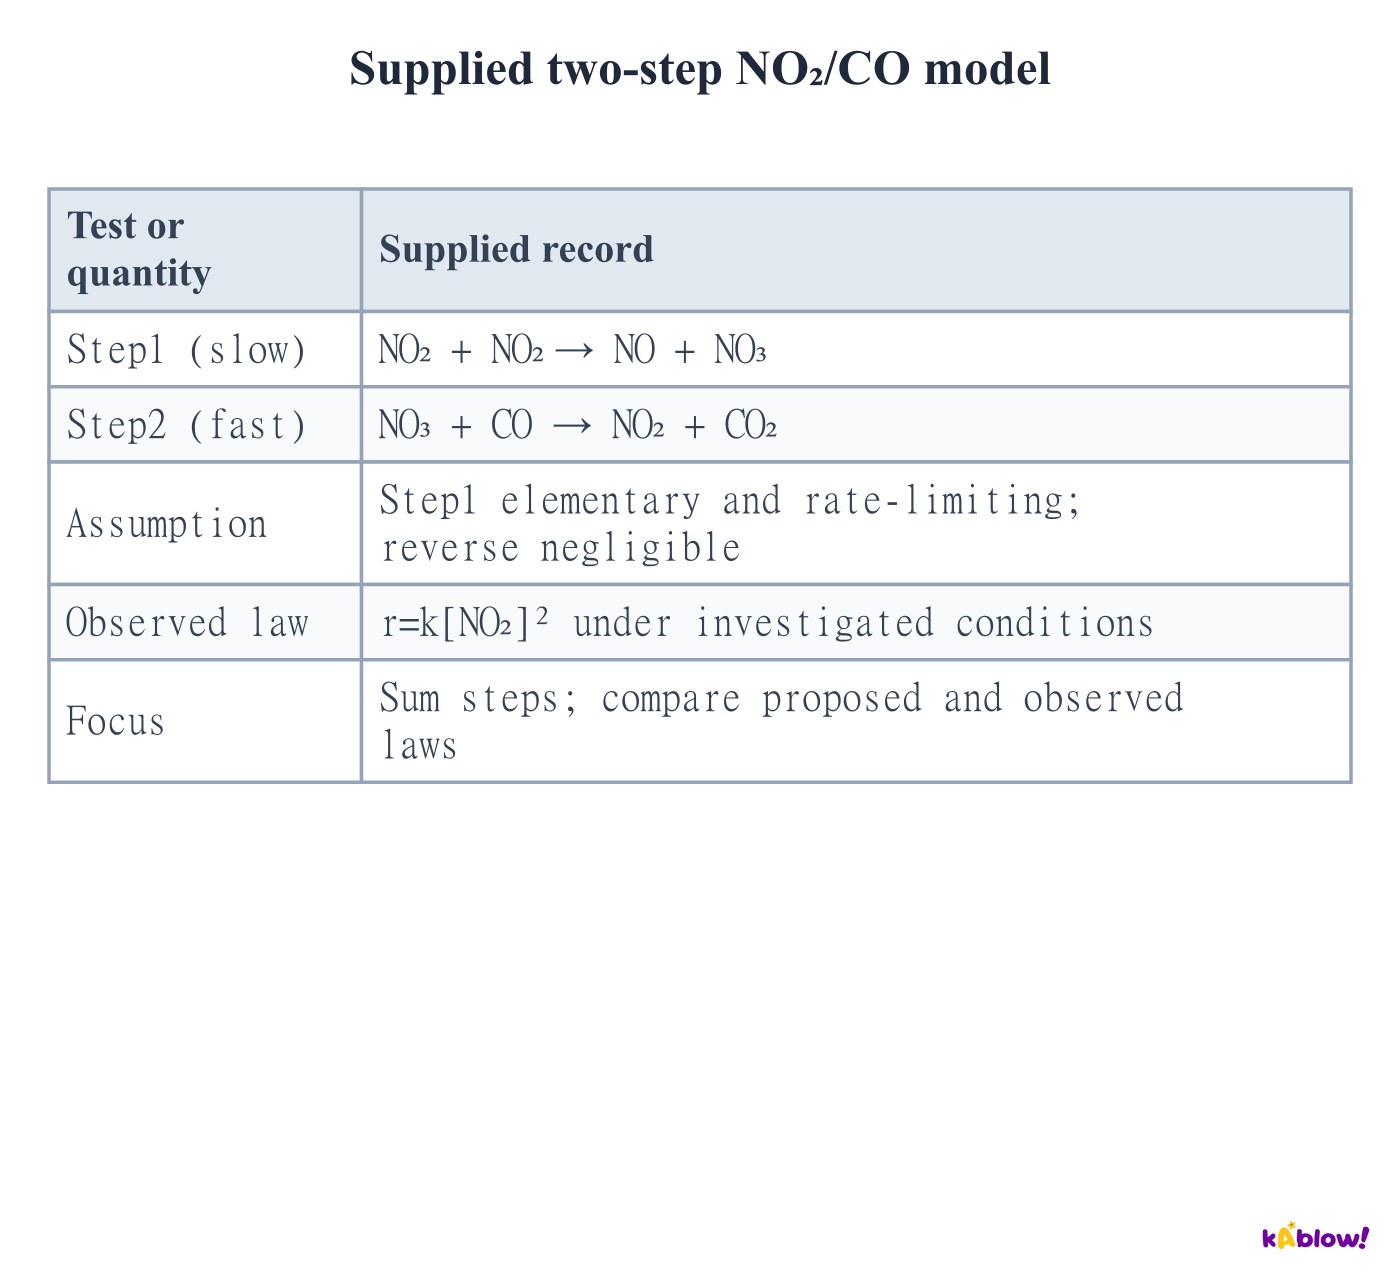
- Add the supplied NO₂/CO steps and cancel species appearing on both sides. The overall equation is NO₂+CO→NO+CO₂; NO₃ is formed then consumed.
- Under the stated elementary slow-first-step approximation, the predicted rate is k[NO₂]², consistent with the supplied observed law.
- Consistency supports a possible mechanism but does not prove it uniquely. Overall coefficients alone would not justify the empirical second order in NO₂.
Supplied two-step NO₂/CO model
Include a prior fast equilibrium when needed
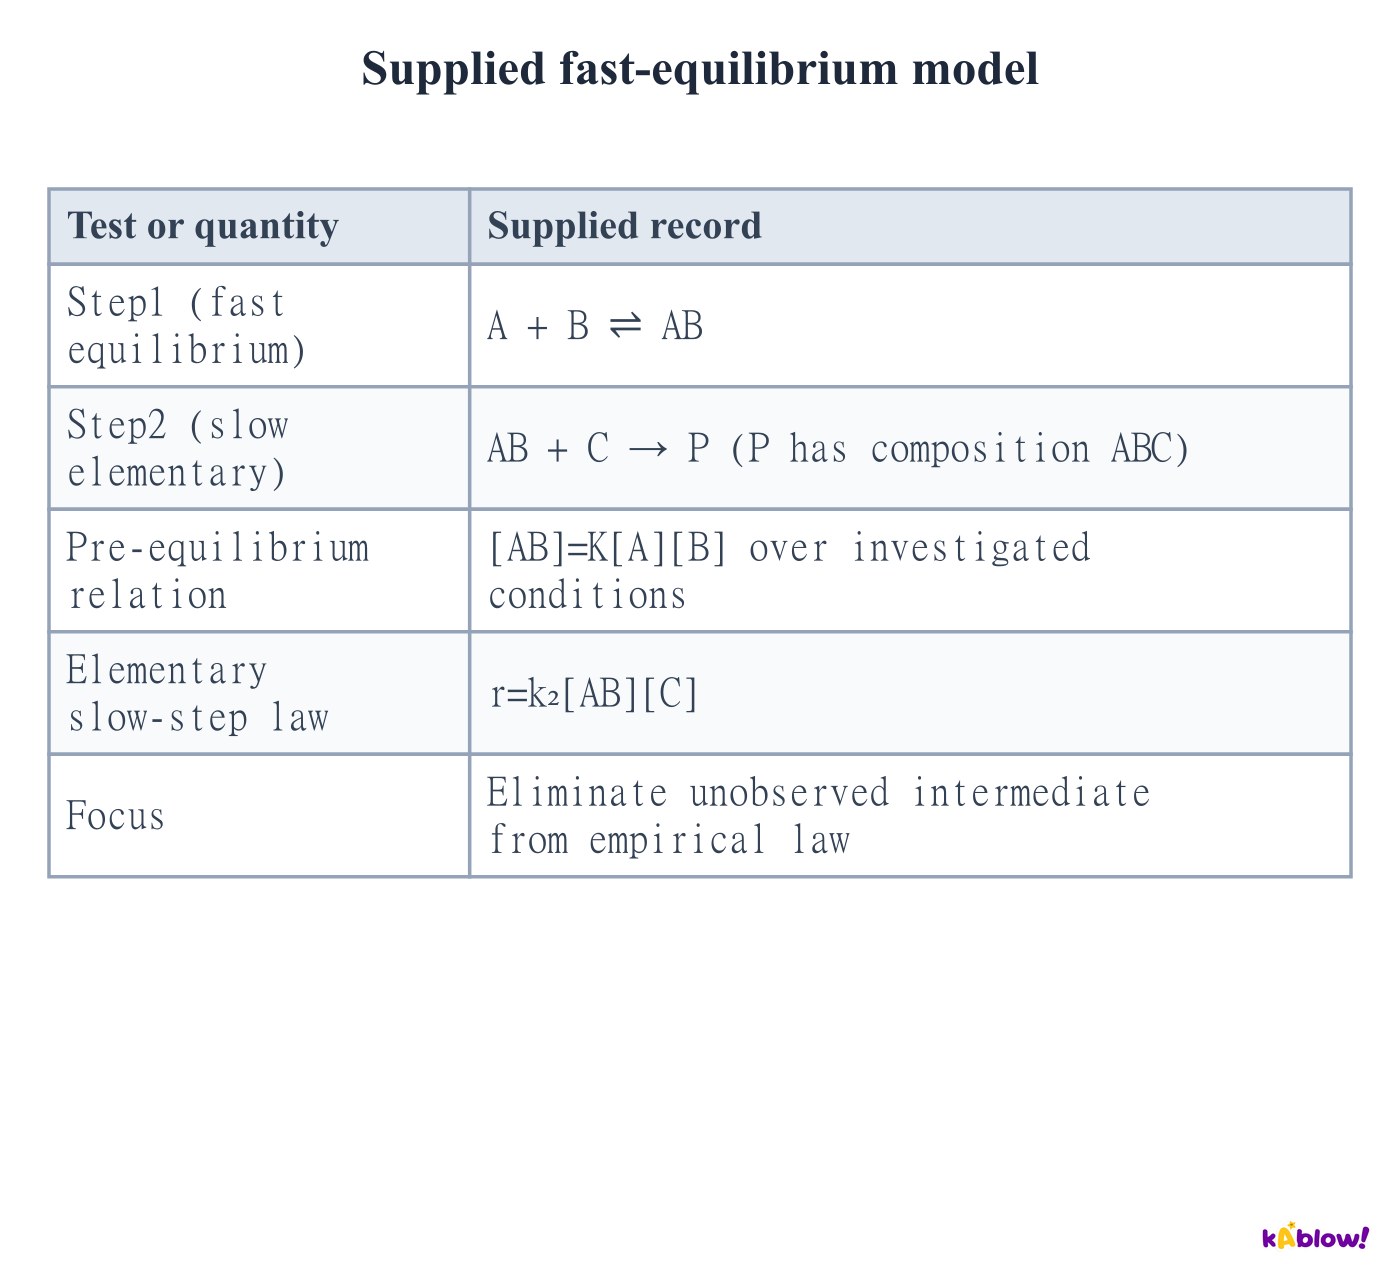
- The slow elementary step gives r=k₂[AB][C]. The prior equilibrium gives[AB]=K[A][B]. Substitute to obtain r=k₂K[A][B][C].
- Thus A and B can appear in the observed rate law even though the slow step directly consumes AB rather than separate A and B.
- The pre-equilibrium relation requires the stated fast reversible conditions. A fast irreversible formation step alone would not justify it.
Supplied fast-equilibrium model
Distinguish catalyst from intermediate
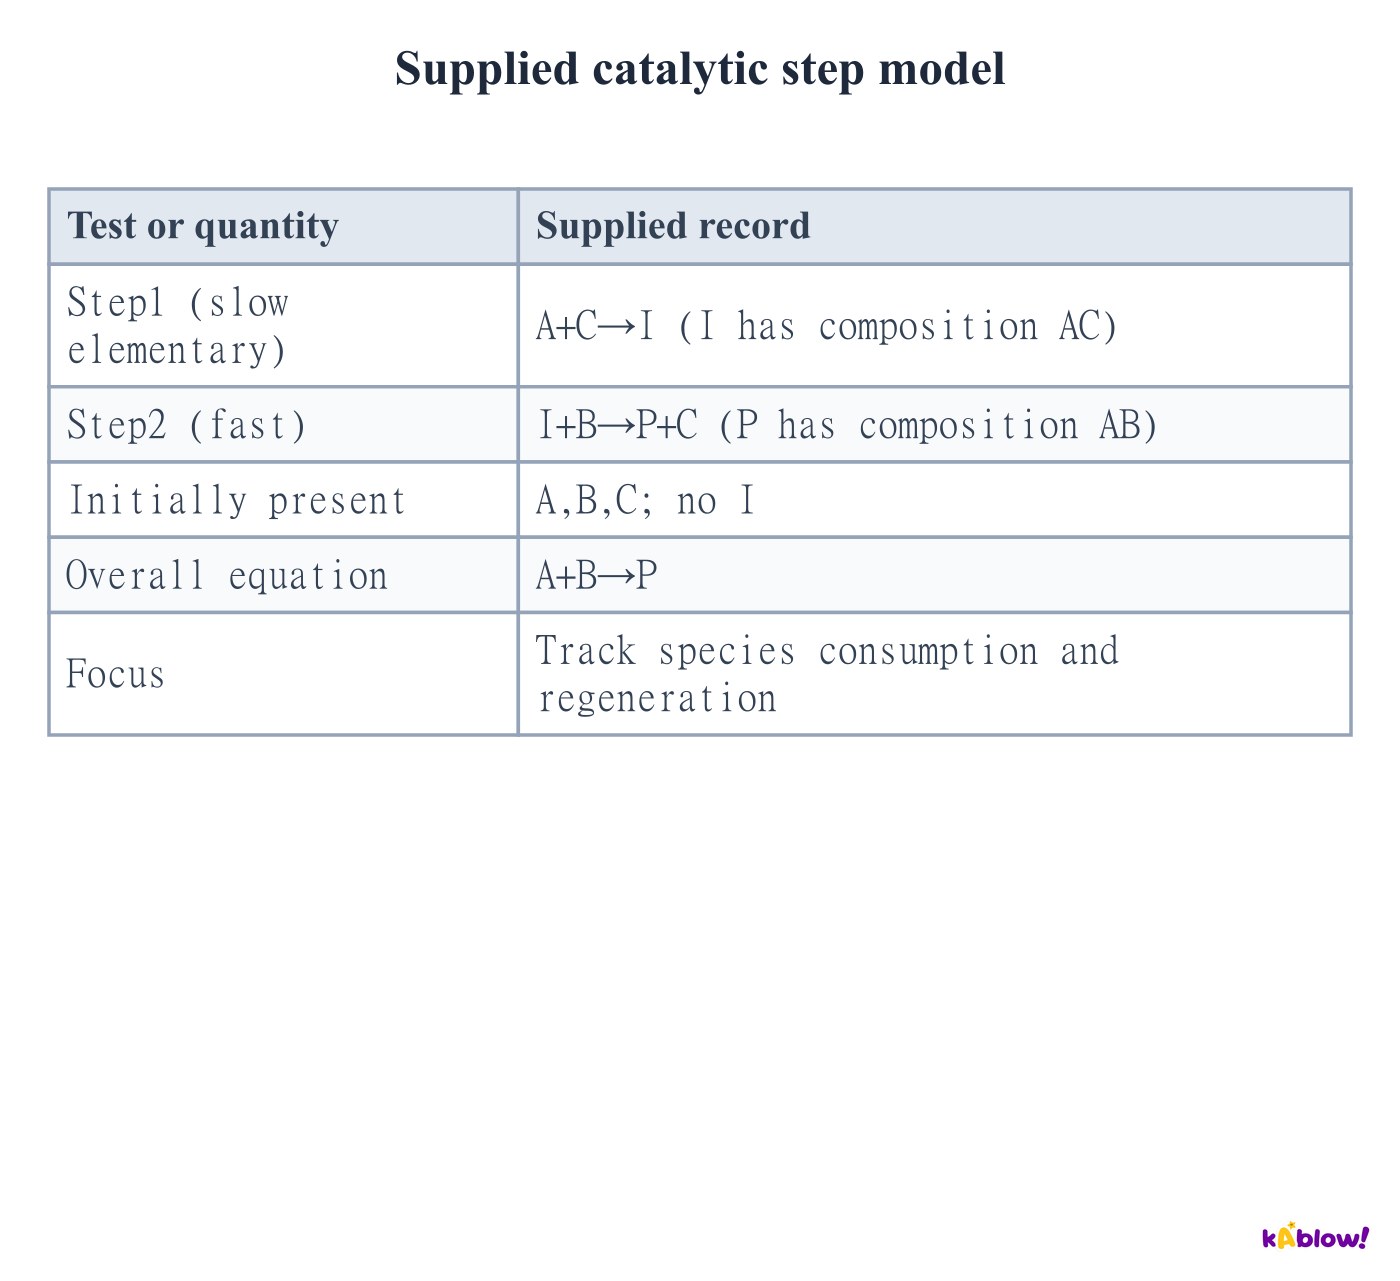
- In the supplied model C is initially present, consumed in step1 and regenerated in step2. It cancels from the overall reaction and acts as the catalyst.
- I is initially absent, forms in step1 and is consumed in step2. It is an intermediate. The stated AC and AB compositions preserve the labelled atom groups.
- A species appearing in an empirical rate law but absent overall is not automatically a catalyst. Use the full consumption/regeneration evidence; intermediates can form before or during a slow step.
Supplied catalytic step model
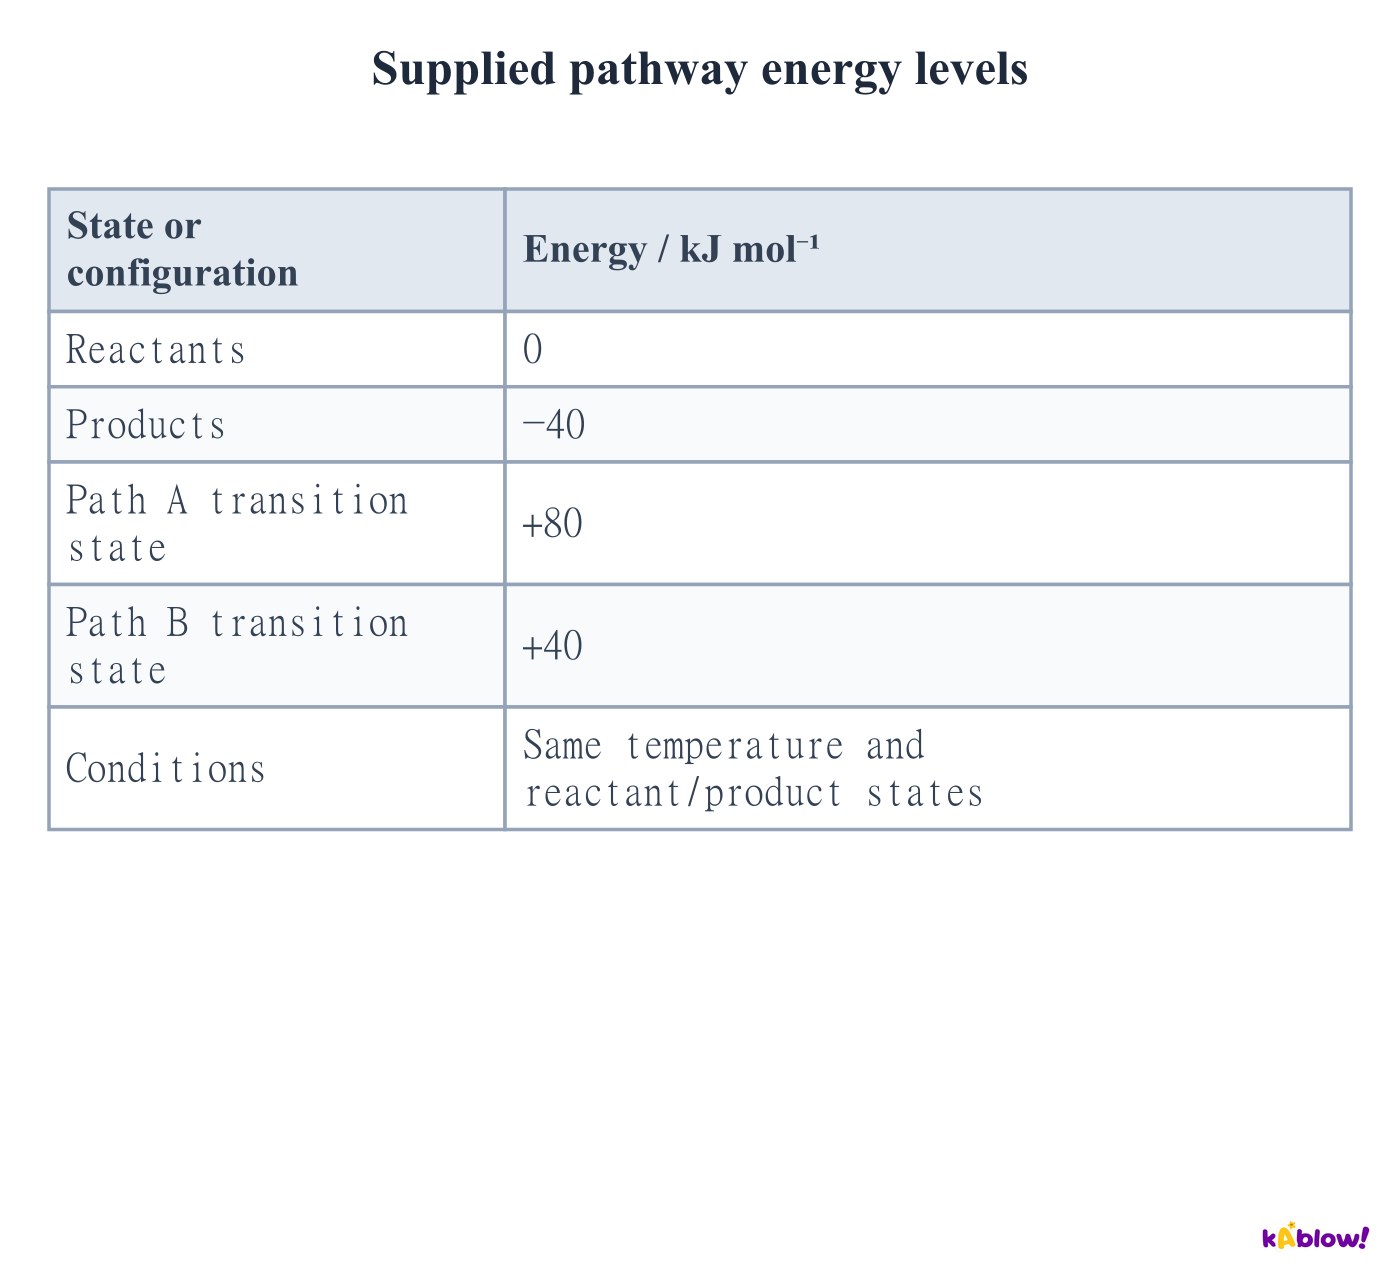
Separate activation barriers from thermodynamics
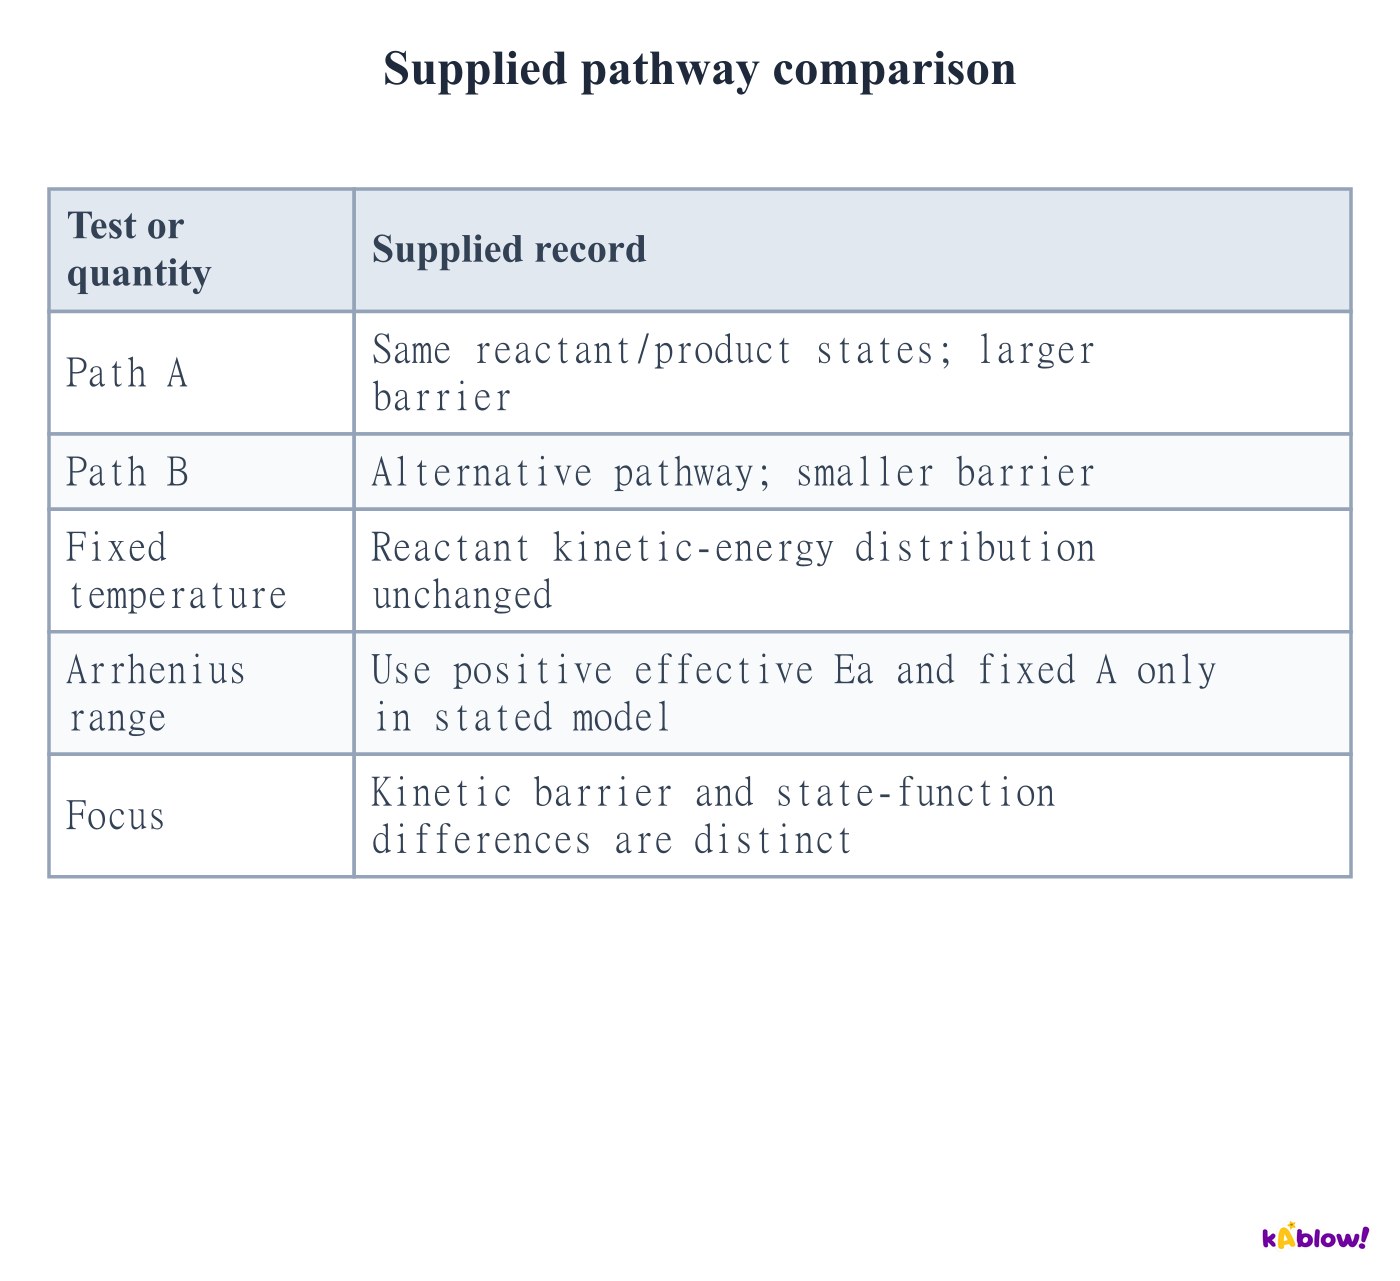
- Activation energy describes the kinetic barrier associated with a pathway. It does not define electrophilic substitution or the reactant–product enthalpy difference.
- A catalyst supplies an alternative route and can change effective kinetic parameters. At the same temperature it does not shift the reactant energy distribution or change the equilibrium constant.
- An intermediate is a species formed and consumed between steps. A transition state lies at a barrier maximum and is not a stable, isolatable intermediate. Rate-law and temperature evidence constrain mechanisms without identifying a unique one.
Supplied pathway comparison
Slide
Sign up free to view the lesson slides
Step through every slide for this topic — plus flashcards and revision notes — with a free account.
Soal latihan
Pratinjau gratis — 8 dari 60 soal. Daftar untuk melihat semuanya.
1.Using the supplied record, what is the mean positive disappearance rate of A?
Medium- A0.0010 mol dm⁻³ s⁻¹
- B0.0020 mol dm⁻³ s⁻¹
- C−0.0020 mol dm⁻³ s⁻¹
- D0.020 mol dm⁻³ s⁻¹
2.For the supplied empirical model, what is the overall order?
Medium- AOne
- BTwo
- CThree
- DFour
3.Which order in A is consistent with supplied rate–concentration plot A?
Medium- AZero
- BFirst
- CSecond
- DThird
4.What happens to rate when concentration doubles on supplied rate–concentration plot B?
Medium- AIt is unchanged
- BIt doubles
- CIt quadruples
- DIt halves
5.By what factor does rate change from[A]=0.25 to0.50 mol dm⁻³ on supplied plot C?
Medium- A2
- B4
- C8
- D0.5
6.Which rate equation fits all three supplied experiments?
Medium- Ar=k[A][B]
- Br=k[A]²[B]
- Cr=k[A][B]²
- Dr=k[A]²
7.What can the supplied pair establish under its stated model?
Medium- Am=2 and n=0 uniquely
- Bm=1 and n=1 uniquely
- Cm+n=2, with individual orders undetermined
- DBoth orders must be zero
8.Calculate k from the supplied numerical record.
Medium- A0.20 dm⁶ mol⁻² s⁻¹
- B2.0 dm⁶ mol⁻² s⁻¹
- C20 dm⁶ mol⁻² s⁻¹
- D2.0 s⁻¹
Unlock all 60 questions, flashcards & more
Buat akun gratis untuk melihat setiap soal, slide, kartu flash, dan catatan ulasan topik ini.