
Population: growth, structure and migration
Belajar sambil bermain
Jawab soal-soal ini untuk dapat energi, lalu memancing dan menjelajah. Tanpa akun.
Catatan pelajaran
Distribution and density
- Distribution describes the spatial pattern of population. Density is the number of residents divided by land area: an invented 120,000 people across 300 km² gives 400 people/km². Averages can conceal cities and sparse rural areas within the same region.
- Physical influences include water, climate, relief and soil; human influences include employment, transport, services, history and policy. These interact. Neither deserts nor fertile land determine population numbers on their own, and density does not establish wealth or quality of life.
Invented density calculation
Population change
- Use the same place and period. Natural change = births − deaths; net migration = immigration − emigration. Total change = natural change + net migration. In the invented table, 1,200 − 800 = +400 naturally, while 300 − 500 = −200 through migration, producing +200 overall.
- Crude birth and death rates express annual events per 1,000 total residents, commonly using a mid-year denominator. A birth rate of 18 and death rate of 7 give natural increase 11 per 1,000, or 1.1% before migration. Crude birth rate differs from fertility per woman; age structure affects crude rates.
- Education, healthcare, survival, reproductive choices, work, housing and child-raising costs can influence fertility and mortality. Do not treat economic development as a single automatic cause or assume every country follows an identical path.
Invented annual population account
Population structure
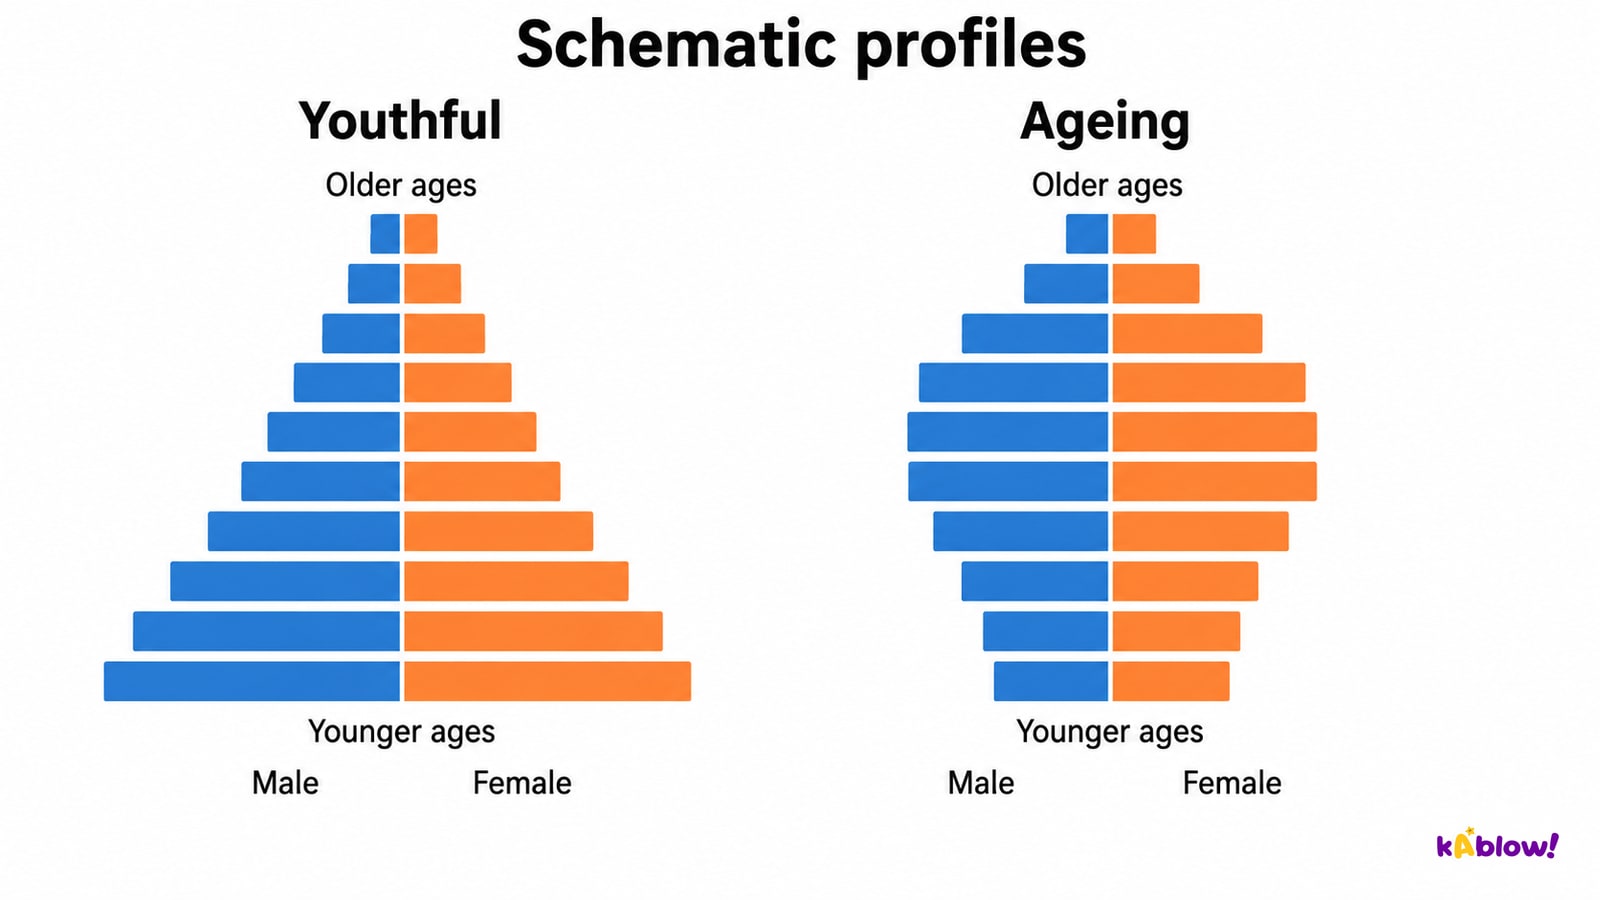
- Population pyramids show population by age band and the recorded sex categories, commonly males left and females right. Young ages appear at the bottom. Read whether values are counts or percentages, the percentage denominator and band widths. The attached profiles are qualitative teaching schematics with no numerical scale, date or country identification.
- A relatively broad base indicates numerous younger cohorts; a narrow base relative to adult groups can reflect fewer recent births. Births, deaths, migration and cohort history affect shape. Ageing means an increasing older-age share, not that the oldest band is necessarily widest. Do not infer a country’s income group from a profile alone.
- With age groups 0–14 and 65+ compared with 15–64, total age dependency ratio = (younger + older) ÷ working-age × 100. For invented groups 30, 10 and 60, it is 66.7 per 100. Definitions vary; age does not tell us who works, needs support or provides unpaid care.
- A youthful population can increase school and job demand; an older population can increase healthcare, care and pension demand. Education, health, participation, productivity and service funding affect outcomes. Recognise contributions at every age and avoid treating people as an inevitable burden.
Schematic age-sex profiles
Population policies
- China’s one-child restrictions emerged around the late 1970s and 1980 and varied across groups, places and time. The universal two-child policy took effect in 2016 after a 2015 announcement; the government announced a three-child policy in 2021. This is a historical sequence, not a claim that these descriptions exhaust current policy.
- Restrictions interacted with son preference and wider changes, contributing to imbalanced sex ratios in some cohorts and smaller younger cohorts. Ageing and fertility change also reflect urbanisation, education, costs, survival and preferences. The often-repeated 400-million-births figure is not used here: attributing hypothetical births to one policy requires a justified counterfactual.
- The 4–2–1 phrase illustrates one adult child potentially supporting two parents and four grandparents, not a universal household arrangement. Pro-natalist policies seek to encourage births through measures such as childcare, parental leave or benefits. Judge outcomes with dated evidence and consider rights, wellbeing, affordability and unintended effects.
Historical China policy changes
Migration
- Migration changes usual residence and can occur within or across national borders. Push factors make an origin less attractive or safe; pull factors attract people elsewhere. People’s freedom of choice varies, and simple voluntary/forced categories can conceal mixed circumstances.
- A refugee is outside their country and needs protection from persecution or serious conflict-related danger. Internally displaced people have fled home while staying inside their country. Not every person displaced by a disaster or seeking work automatically meets the refugee category.
- Origin communities may receive remittances and return skills, while losing particular workers or experiencing separation. Destinations may gain labour, businesses, cultural links and taxes while needing housing, schools and services. Impacts depend on policy, local capacity and the people concerned; they are not uniformly positive or negative.
Slide
Sign up free to view the lesson slides
Step through every slide for this topic — plus flashcards and revision notes — with a free account.
Soal latihan
Pratinjau gratis — 8 dari 38 soal. Daftar untuk melihat semuanya.
1.What is the crude birth rate?
Easy- Abirths per 1000 people per year
- Bdeaths per 1000
- Cmigration per 1000
- Dpeople per km²
2.What is the crude death rate?
Easy- Abirths per 1000
- Bmoves per 1000
- Cpeople per km²
- Ddeaths per 1000 people per year
3.How is natural population change calculated for a defined place and period?
Easy- Amigration
- Bdensity
- Cbirths minus deaths
- Ddeaths minus births
4.What is net migration?
Easy- Adensity
- Bimmigration minus emigration
- Cbirths minus deaths
- Ddeaths minus births
5.What does a population pyramid base that is broad relative to older age groups most directly indicate?
Easy- Arelatively numerous younger age groups on the chart’s stated scale
- Blow birth rate
- Cageing
- Dno children
6.What is a dependency ratio?
Easy- Abirth versus death
- Bdensity
- Cmigration rate
- Dselected younger and older age groups compared with a defined working-age group
7.Which combination can help explain high population density in some places?
Easy- Amountains
- Bice
- Cfertile land and jobs
- Ddeserts
8.Which combination can help explain low population density in some places?
Easy- Aservices
- Bharsh climate or difficult relief
- Cfertile soil
- Djobs
Unlock all 38 questions & more
Buat akun gratis untuk melihat setiap soal, slide, kartu flash, dan catatan ulasan topik ini.