
Map skills: grid references, scale, contours and direction
플레이하며 배우기
이 문제들을 풀어 에너지를 얻은 뒤 낚시하고 탐험하세요. 계정이 필요 없어요.
교육자를 위해: Map skills: grid references, scale, contours and direction(Geography, Geographical Skills)을(를) 위한 바로 쓸 수 있는 수업 슬라이드, 복습 노트 — 수업에 사용하거나, 학습자들이 실시간 게임으로 즐기는 인터랙티브 클래스 활동으로 진행하세요.
수업 노트
Reading Ordnance Survey maps
- Eastings label vertical north–south lines, with values increasing eastward. Northings label horizontal east–west lines, with values increasing northward. Always give the easting before the northing. The memory aid across then up refers to how the values increase, not to the orientation of the lines.
- A four-figure reference identifies a 1 km square by its west and south grid lines. In the exact grid example, the upper point lies in 3427. Subdivide mentally into tenths: five tenths east and eight tenths north give 345278. This six-figure convention identifies a 100 m square, not an infinitely precise point. Preserve leading zeros and include the National Grid’s two-letter 100 km prefix for a full unambiguous reference.
- Scale ratios compare equal units. At 1:50,000, 1 cm = 500 m; at 1:25,000, 1 cm = 250 m. Trace bends with thread or short paper-edge segments and total the length. These are plan-view ground distances: actual surface travel can be longer on slopes. A graphic scale remains useful when resized with its map; the original printed ratio no longer applies to centimetres on a resized display.
- A bearing is measured clockwise from a stated north at the starting point, using three digits. North is 000°, east 090°, south 180° and west 270°. A reverse bearing differs by 180°, reduced to the 000°–359° range. Distinguish grid, true and magnetic north.
Invented kilometre grid
Relief
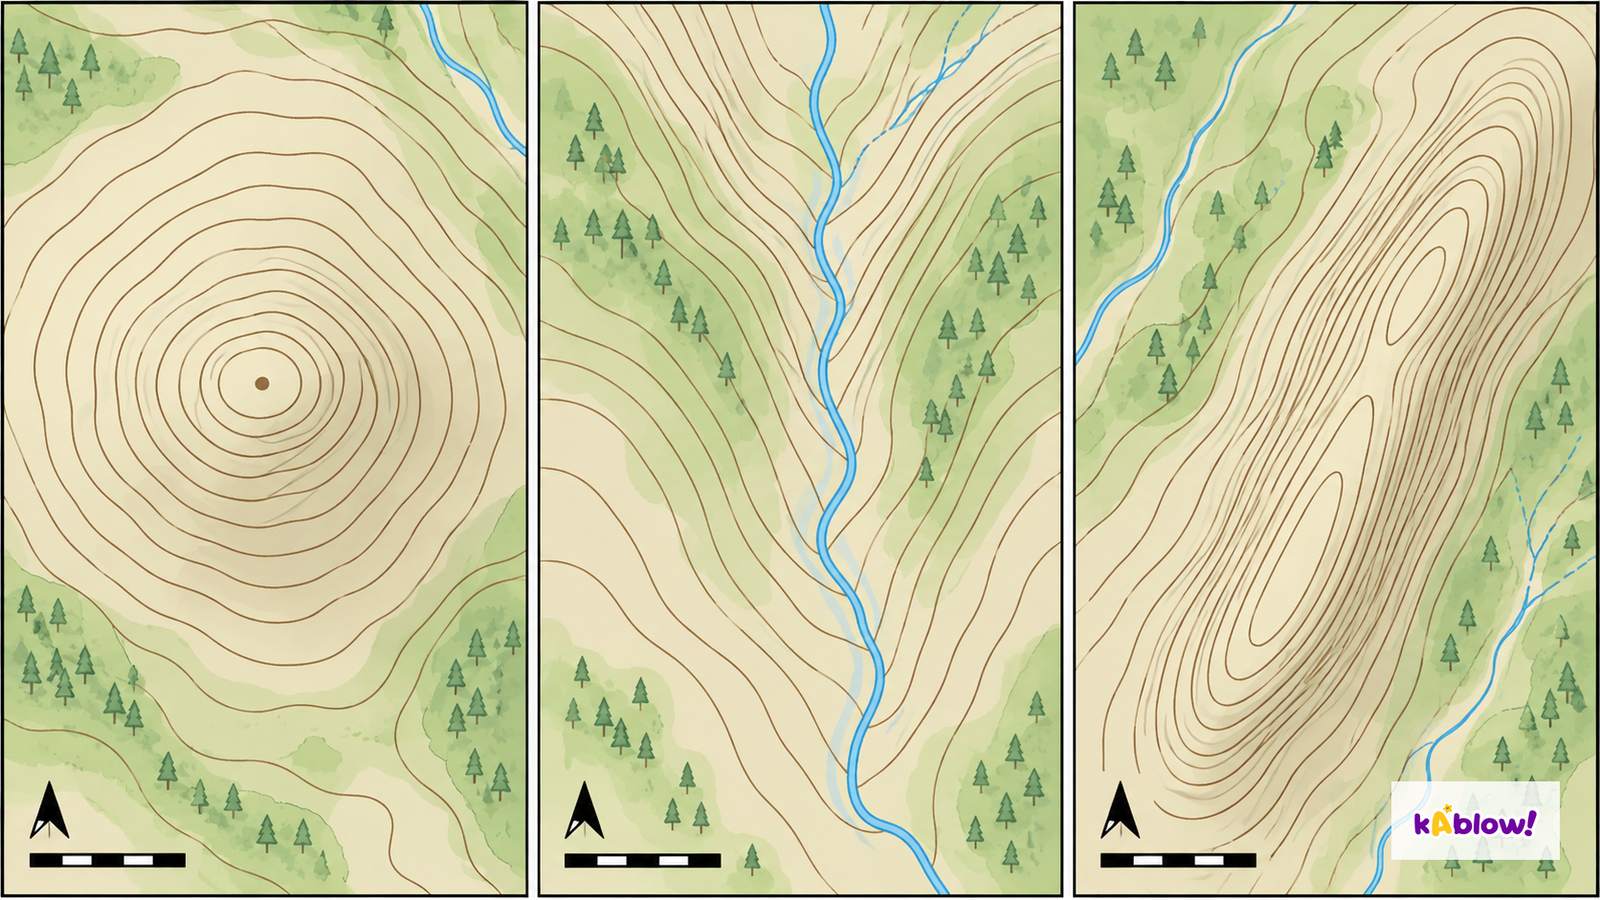
- Contours join equal elevations above a stated datum. Read the interval: a pair of adjacent contours might differ by 5 or 10 m, depending on the map. Compare spacing only with the same scale and vertical interval. Closely spaced contours then indicate a steeper slope, while wide spacing indicates a gentler slope.
- The attached image is an unlabelled conceptual comparison of a hill, valley and ridge, not a real survey. Closed contours can indicate a hill when heights increase inward; depression symbols or values can instead indicate a hollow. Valley bends point uphill or upstream; ridge bends project downhill. Verify with height labels rather than shape alone.
- A spot height records elevation at a surveyed point with the map’s stated precision and datum. A triangulation pillar is a survey station historically used to measure angles; it need not stand on a summit. Gradient uses vertical rise divided by horizontal distance: 60 m over 300 m gives 60:300 = 1:5.
- To construct a cross-section, mark every contour intersection along the chosen transect with its elevation. Transfer the positions to a distance axis and heights to a stated vertical scale, then draw a sensible profile. If vertical and horizontal scales differ, the relief is exaggerated; do not invent detailed shape between observations.
Conceptual hill, valley and ridge
Symbols and land use
- Check the specific map legend. Watercourse symbols are normally blue, woodland is generally green with tree symbols and contours are commonly brown. Blue can also mark grid lines or motorways; road classes have different colours and styles, and rights-of-way colours differ between OS products.
- Combine symbols, pattern and context to describe land use. Tree symbols support woodland, field boundaries and farm labels can support agricultural use, and building symbols indicate structures. Do not claim a precise activity from colour alone or confuse a route’s legal status with its physical surface.
Settlement patterns
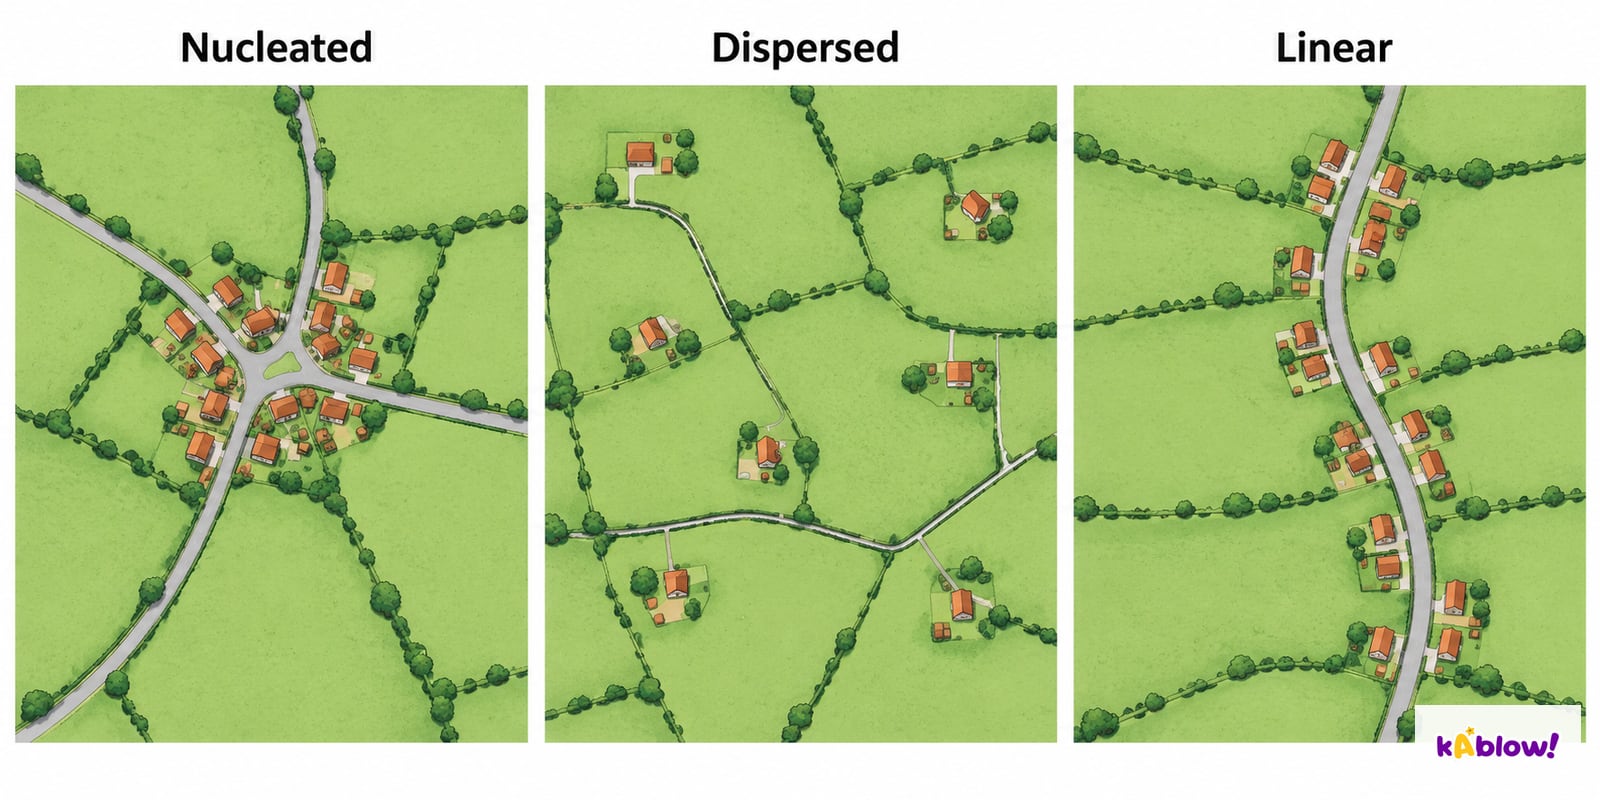
- Nucleated and clustered are synonyms for a compact concentration around a focus. Dispersed settlements have isolated or widely separated buildings. Linear settlements follow an elongated route or feature, such as a road, river or coastline. Real places can combine patterns.
- Use the invented plan illustration to compare distribution rather than to infer population or a named place. Local site concerns the ground occupied, such as a terrace; situation concerns wider routes, neighbouring towns and resources. A crossing may attract movement and trade, but the explanation needs evidence.
Invented settlement patterns
Describing routes and areas
- Describe the route with its starting point, direction changes, grid references, measured distances and land use. Identify climbs or descents from labelled contours and heights. Use the key to recognise crossings, path types and barriers.
- Support explanations with map evidence and qualify inference. A bridge and converging routes may help explain a settlement focus; they do not prove its historical origin on their own. Do not assume the straight-line route is the shortest usable route or that a public route is safe in all conditions.
슬라이드
연습 문제
무료 미리 보기 — 37개 중 8개 문제. 가입하면 전부 볼 수 있어요.
1.What colour shows water on an OS map?
Easy- Ablue
- Bgreen
- Cbrown
- Dblack
2.What colour shows woodland?
Easy- Ablue
- Bred
- Cbrown
- Dgreen
3.What are contour lines?
Easy- Arivers
- Brailways
- Clines joining points of equal height
- Droads
4.What are eastings?
Easy- Aroads
- Bvertical grid lines numbered left to right
- Chorizontal lines
- Dcontours
5.What are northings?
Easy- Ahorizontal grid lines numbered upward
- Bvertical lines
- Ccontours
- Drivers
6.How many numerical digits are in an OS six-figure grid reference, excluding its two-letter National Grid prefix?
Easy- Afour
- Beight
- Ctwo
- Dsix
7.What does 1:50 000 mean?
Easy- A1 cm is 5 km
- Bnone
- C1 cm on the map is 50,000 cm on the ground
- D1 cm is 50 cm
8.On a 1:50 000 map, 3 cm represents:
Easy- A150 m
- B1.5 km
- C3 km
- D15 km
기출 문제
이 주제의 기출 문제 연습이 곧 나와요.
곧 출시