Energy & Feeding Relationships
Learn it by playing
Answer these questions to earn energy, then fish and explore. No account needed.
Lesson notes
Transfer of Energy
- The Sun is the principal source of energy input to biological systems.
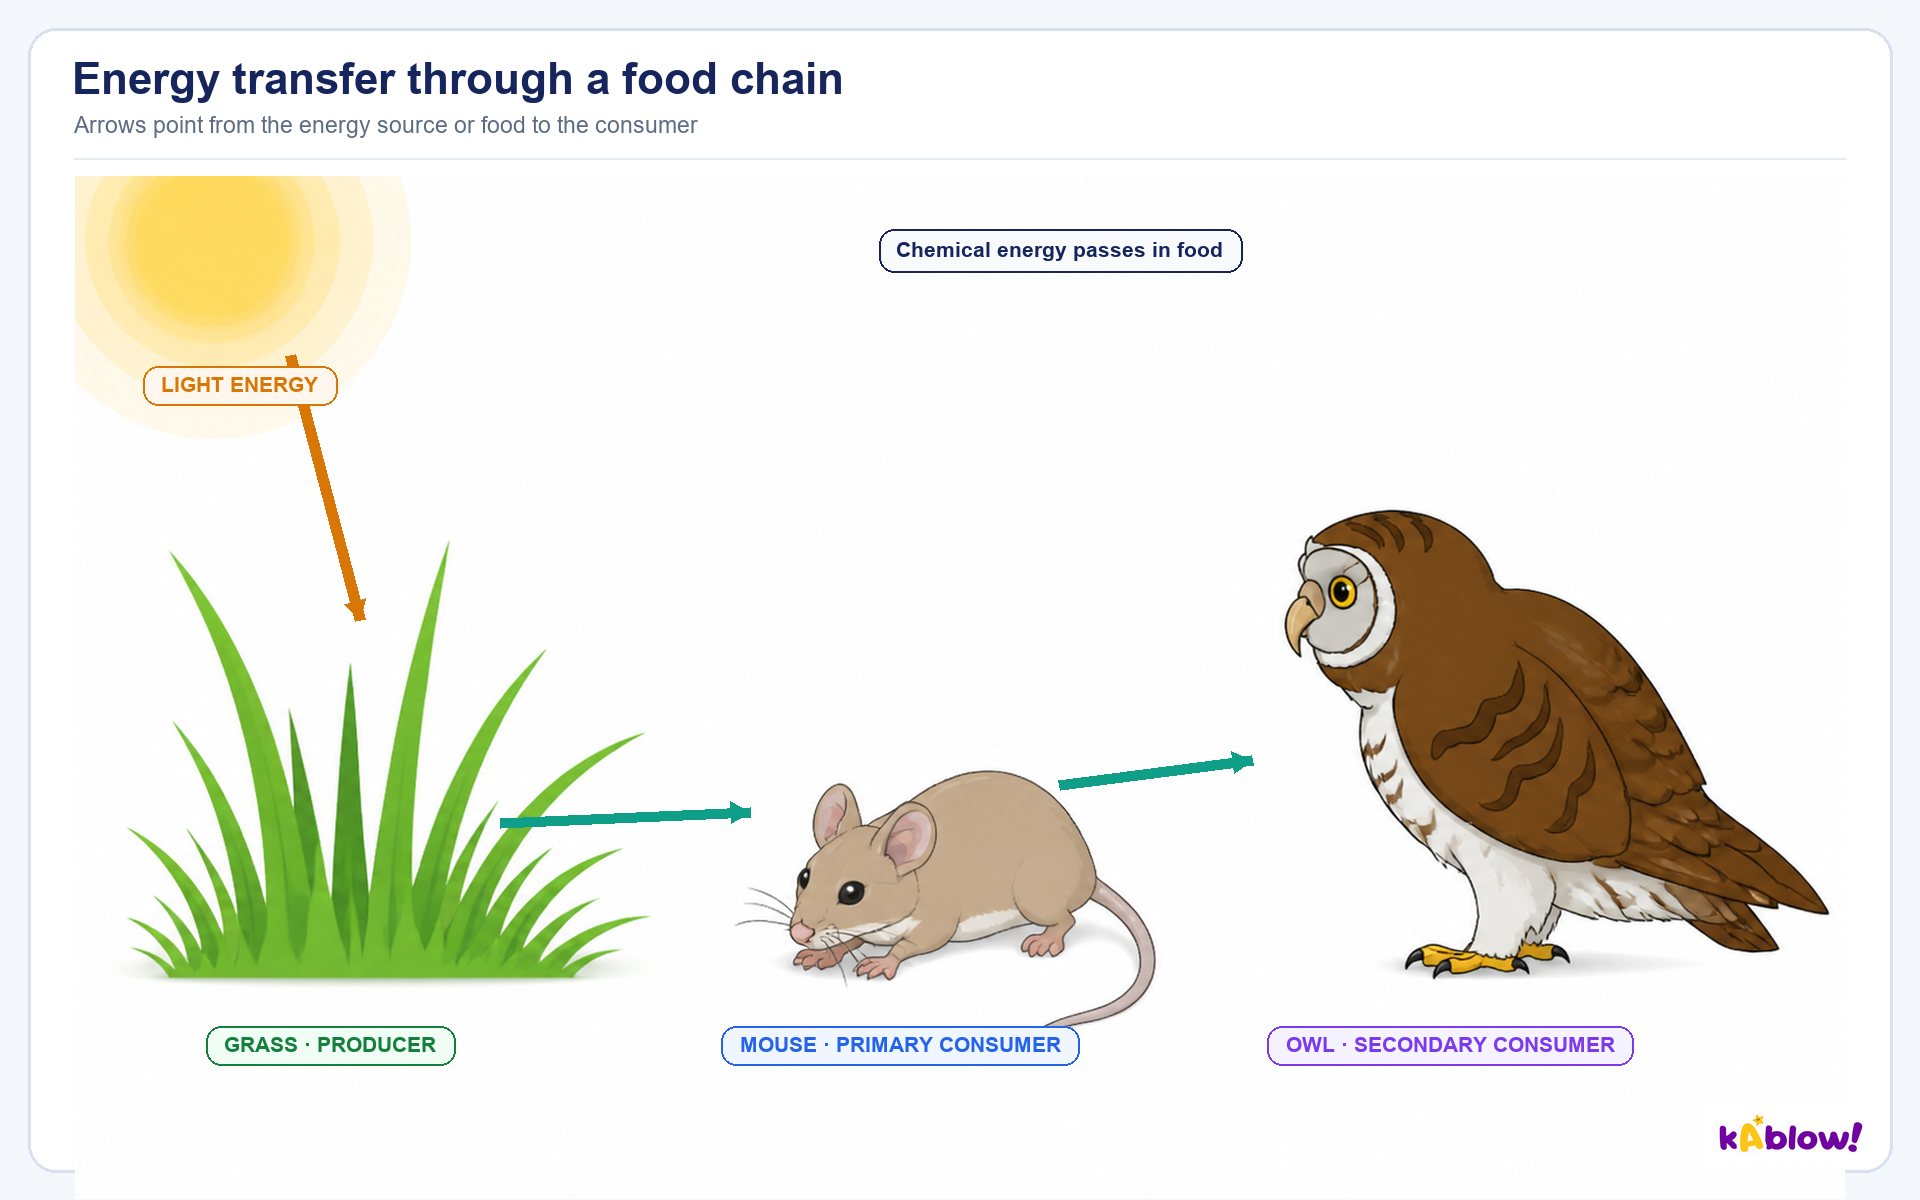
- Energy flows through living organisms as light energy from the Sun and chemical energy in organisms.
- Energy is eventually transferred to the environment, e.g. as heat.
Food Chains & Food Webs
- A food chain shows the transfer of energy from one organism to the next, starting with a producer.
- Arrows in a food chain represent the transfer of energy from one trophic level to the next.
- Energy is transferred between organisms by ingestion (eating).
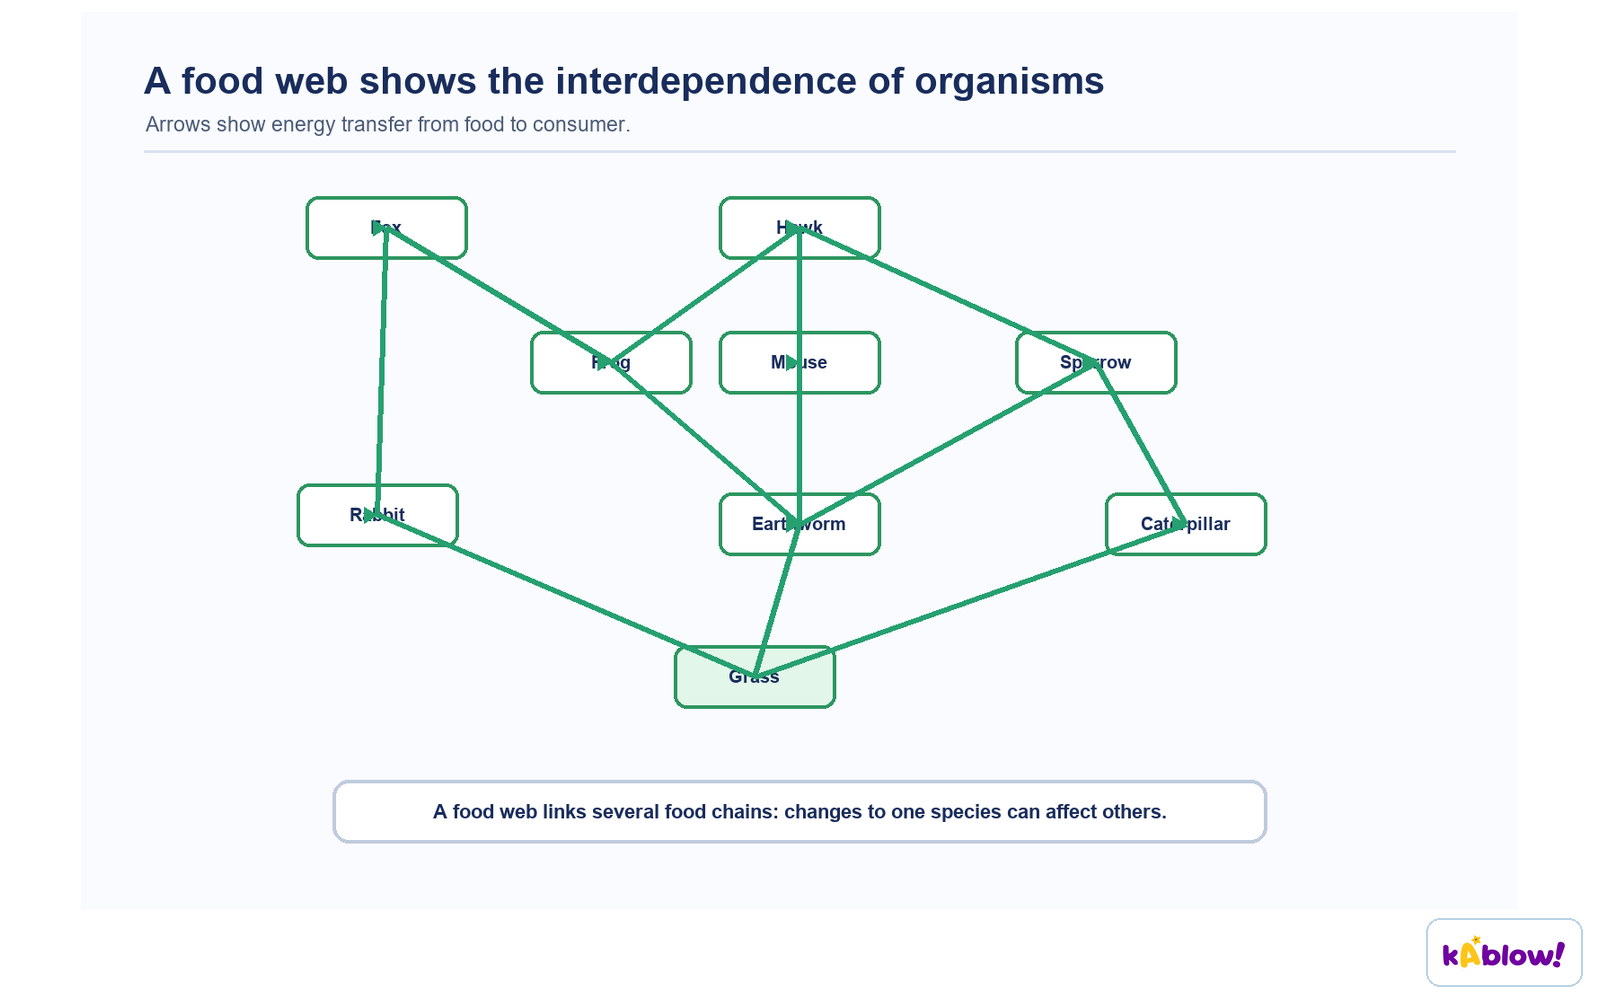
- A food web is a network of interconnected food chains, showing interdependence of organisms.
- Changes in one population can affect others; e.g. if earthworms decrease, grass increases, frogs and mice decrease, sparrows decrease slightly.
A food web shows the interdependence of organisms
Pyramids of Number
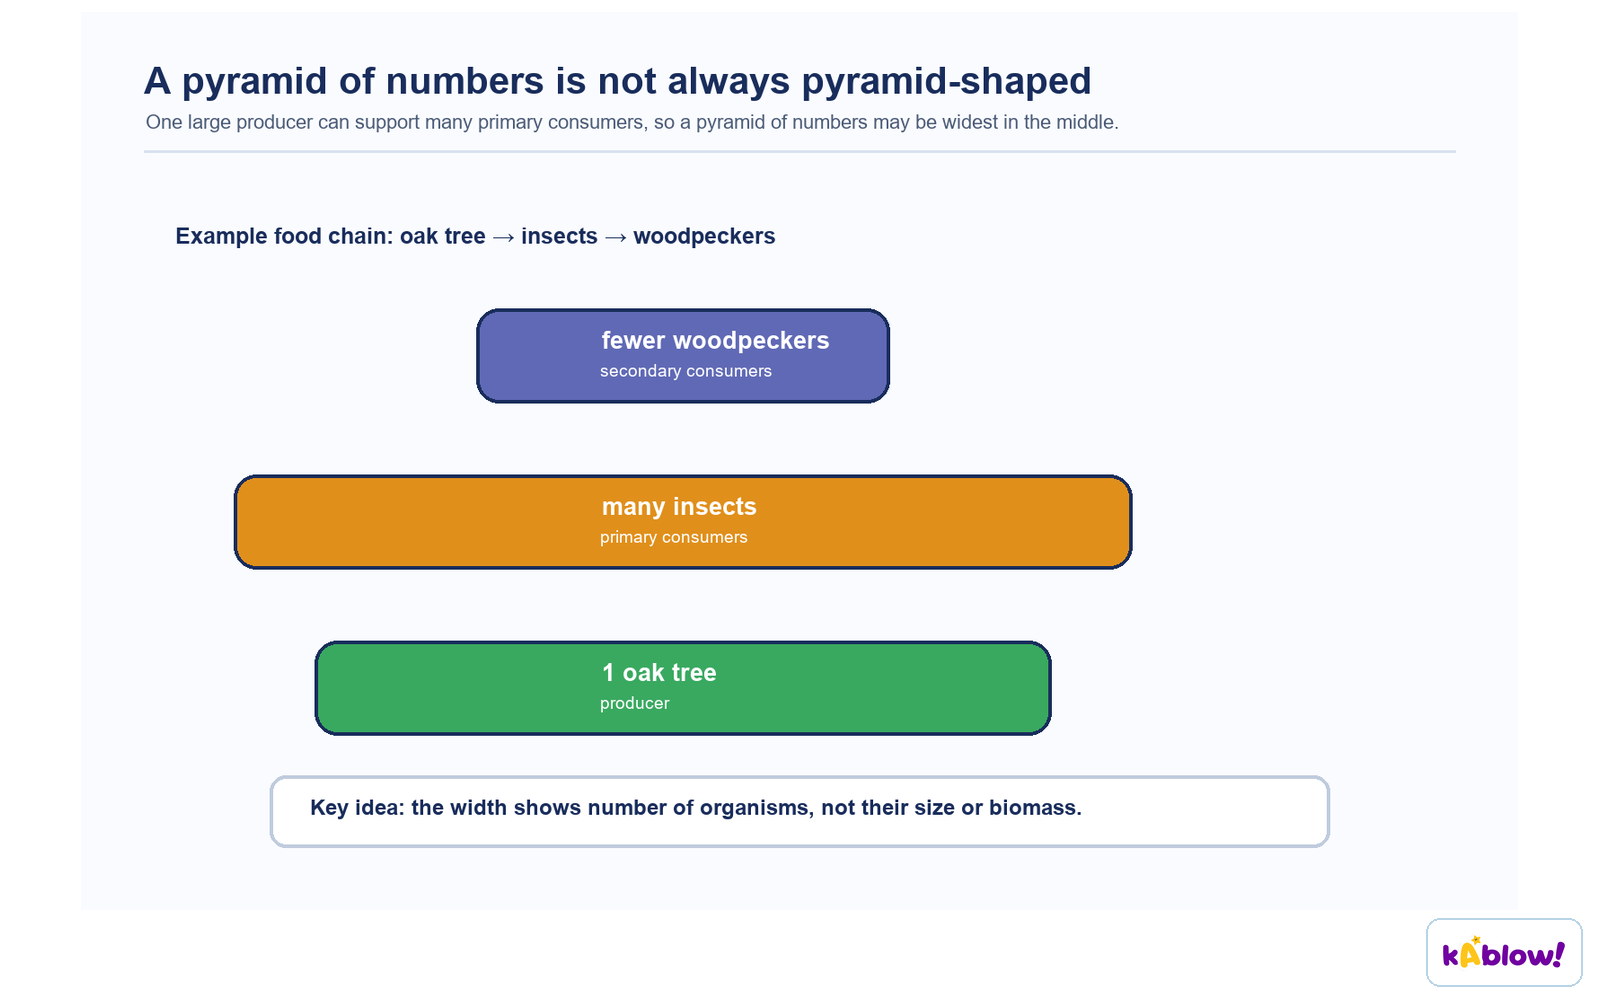
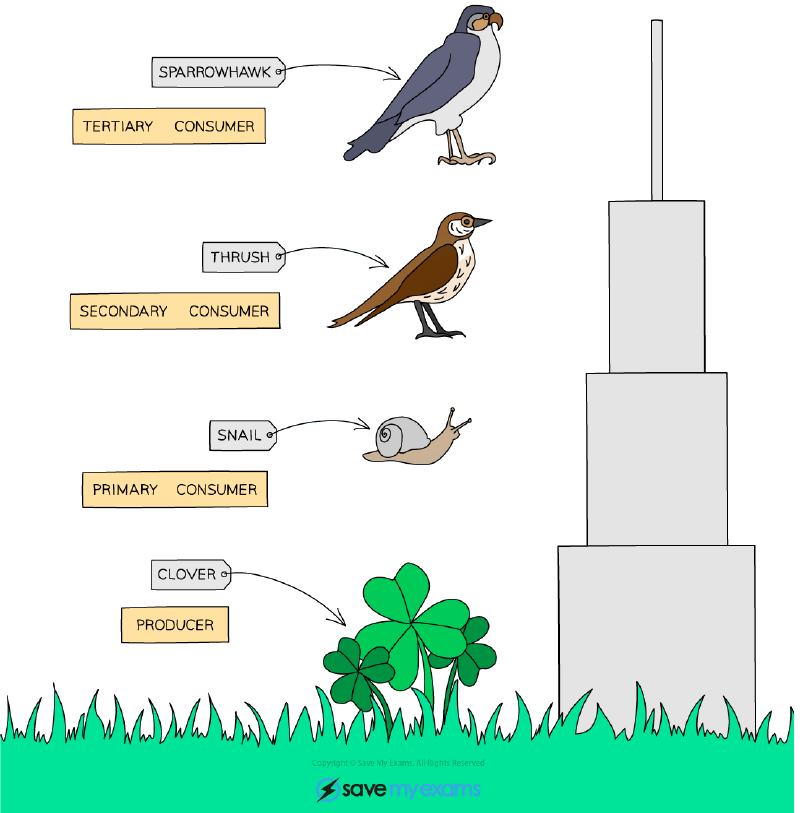
- A pyramid of numbers shows the number of organisms at each trophic level.
- The width of each bar indicates the number of organisms.
- Pyramids of numbers are not always pyramid-shaped because one large producer (e.g. oak tree) can support many consumers.
- Rules: producers at bottom, then primary, secondary, tertiary consumers; label each bar; draw to scale if graph paper provided.
A pyramid of numbers is not always pyramid-shaped
Pyramids of Biomass
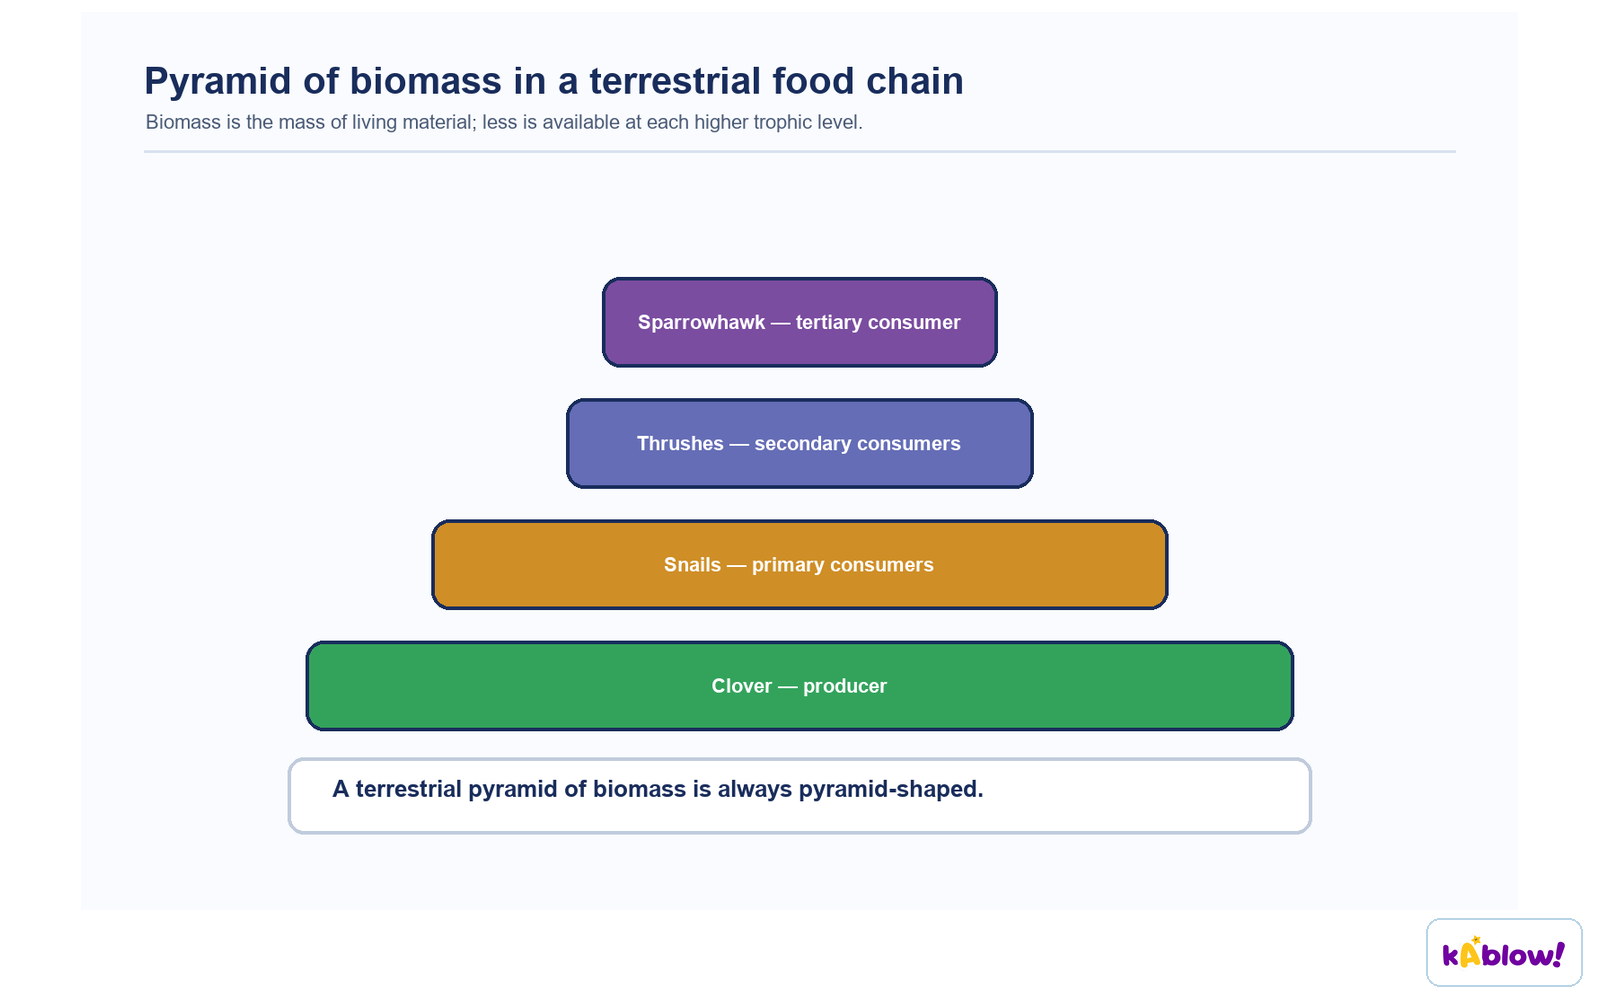
- A pyramid of biomass shows the mass of living matter (dry mass) at each trophic level.
- Pyramids of biomass are always pyramid-shaped because mass decreases up the food chain.
- Biomass gives a more accurate representation of living matter and stored energy than numbers.
A pyramid of biomass is always pyramid-shaped
Pyramids of Energy (Extended)
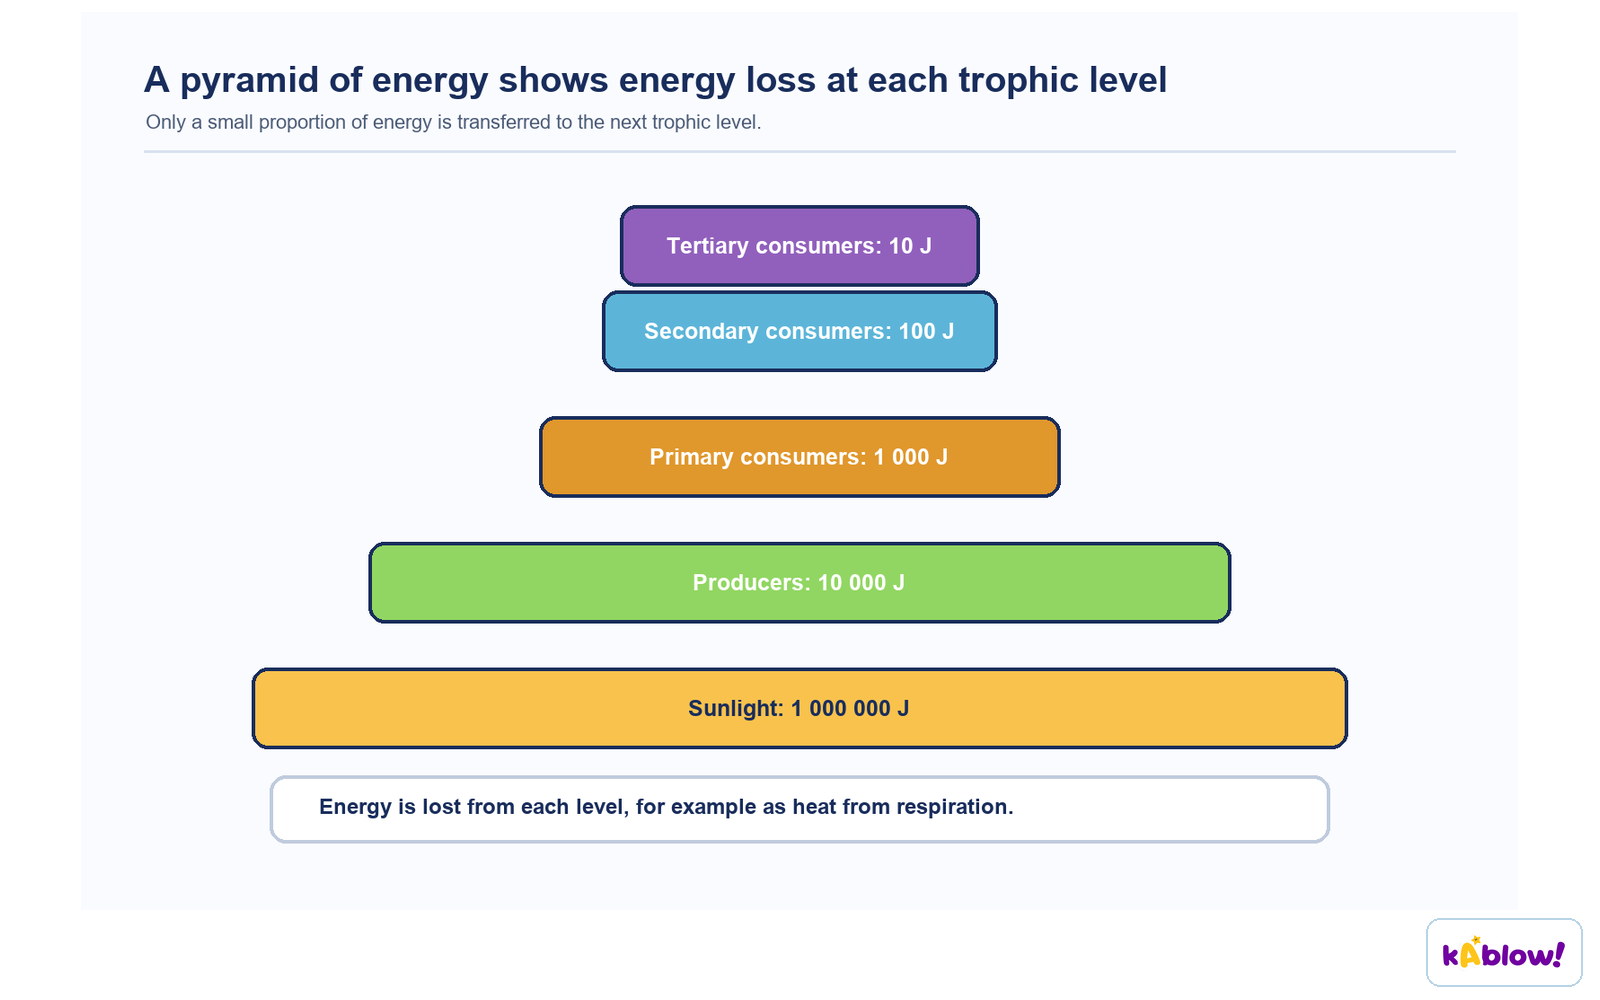
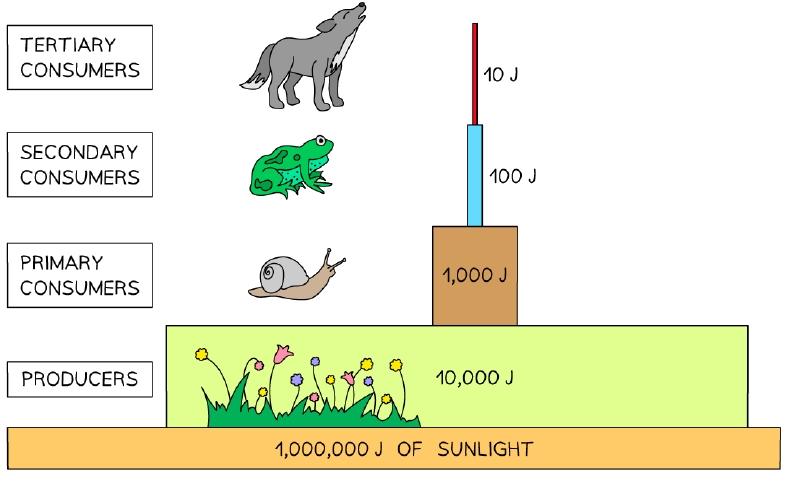
- Energy is lost between trophic levels due to excretion, movement, heat, uneaten parts, and undigested waste (faeces).
- Only about 10% of energy stored at each trophic level is available to the next.
- This explains why food chains are rarely more than 5 organisms long.
- A pyramid of energy visually represents energy stored at each level and highlights energy loss.
A pyramid of energy shows energy loss at each trophic level
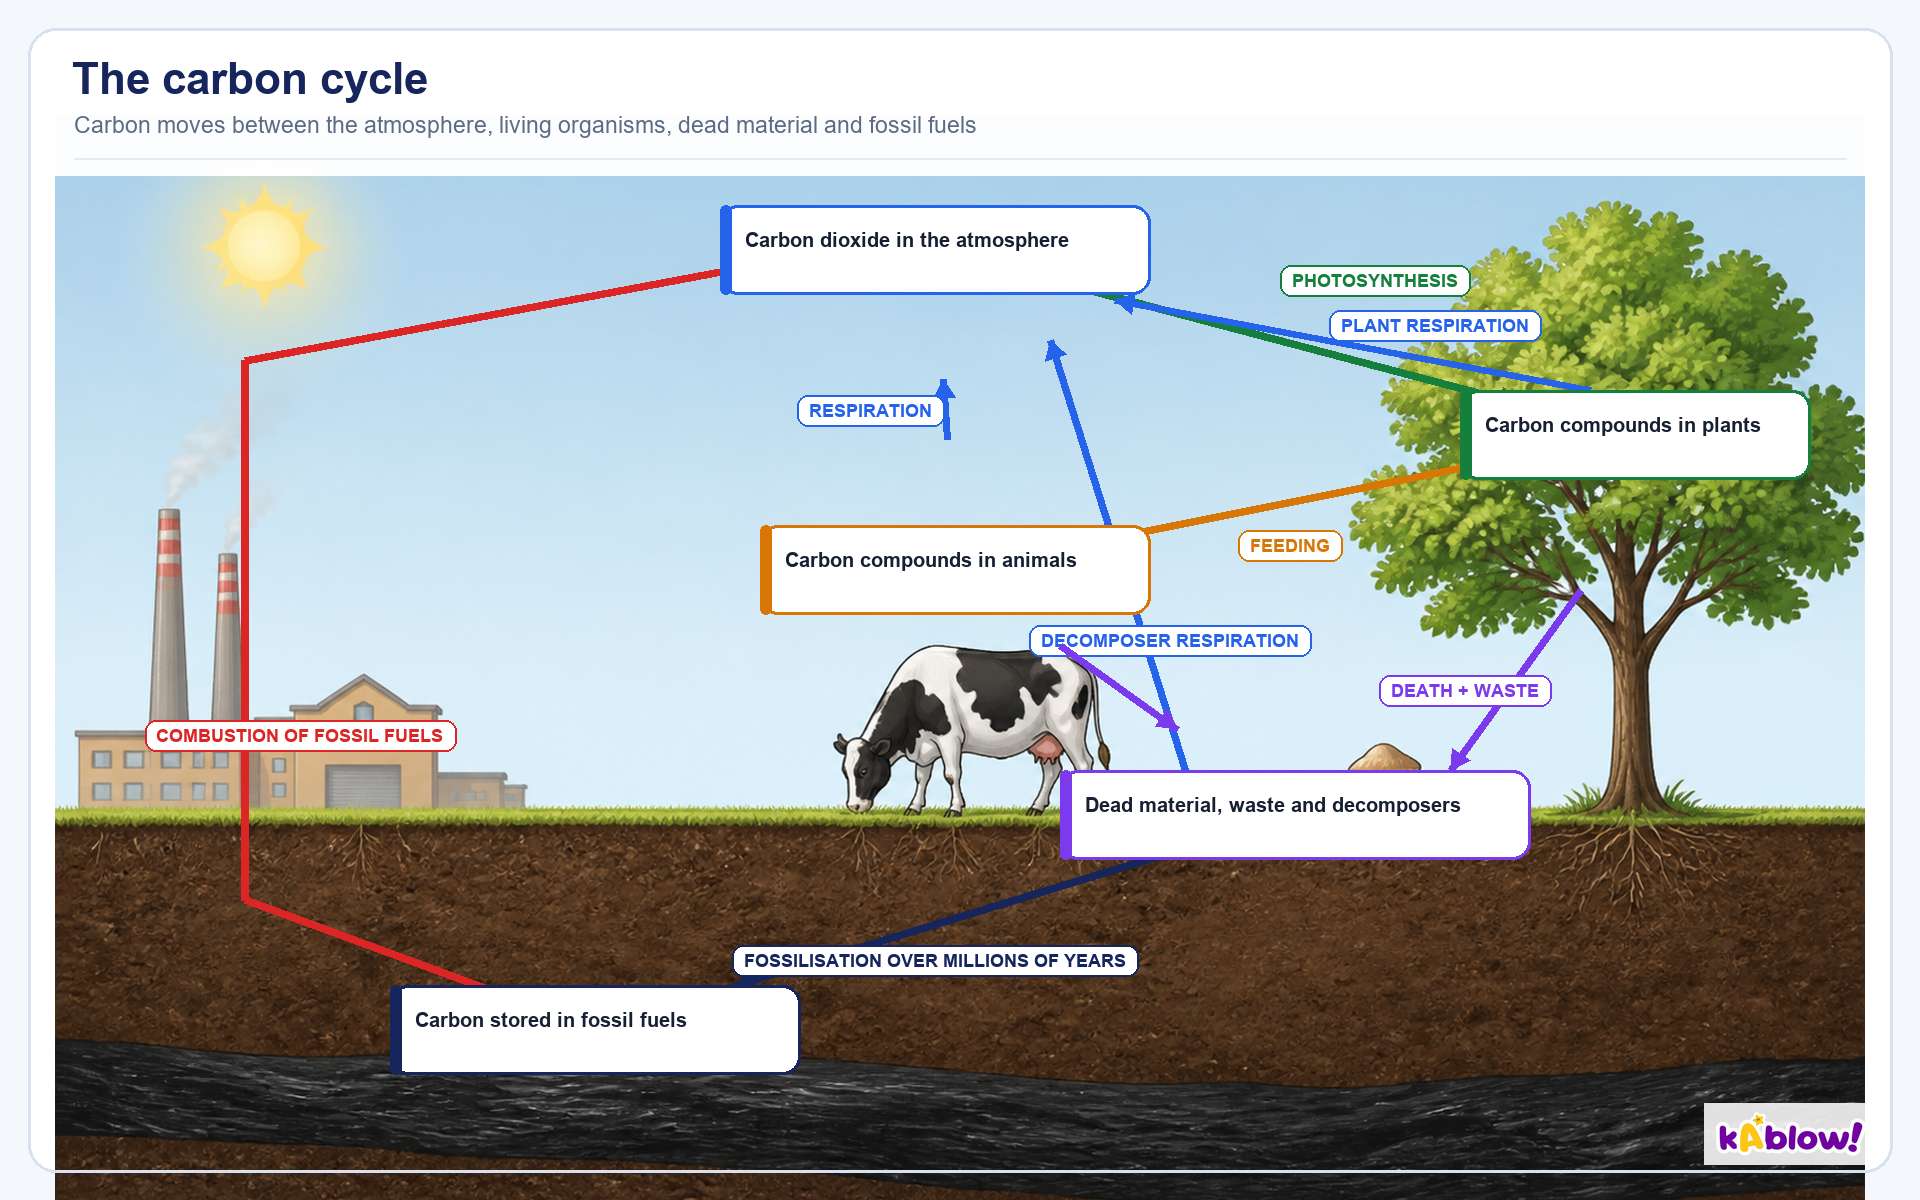
The Carbon Cycle
- Carbon is taken from the atmosphere as CO₂ by plants during photosynthesis.
- Carbon is passed to animals and decomposers by feeding.
- Carbon is returned to the atmosphere as CO₂ by respiration (plants, animals, microorganisms).
- Fossil fuels form from dead organisms; combustion of fossil fuels releases CO₂.
- Deforestation reduces CO₂ uptake and burning trees releases more CO₂.
The carbon cycle
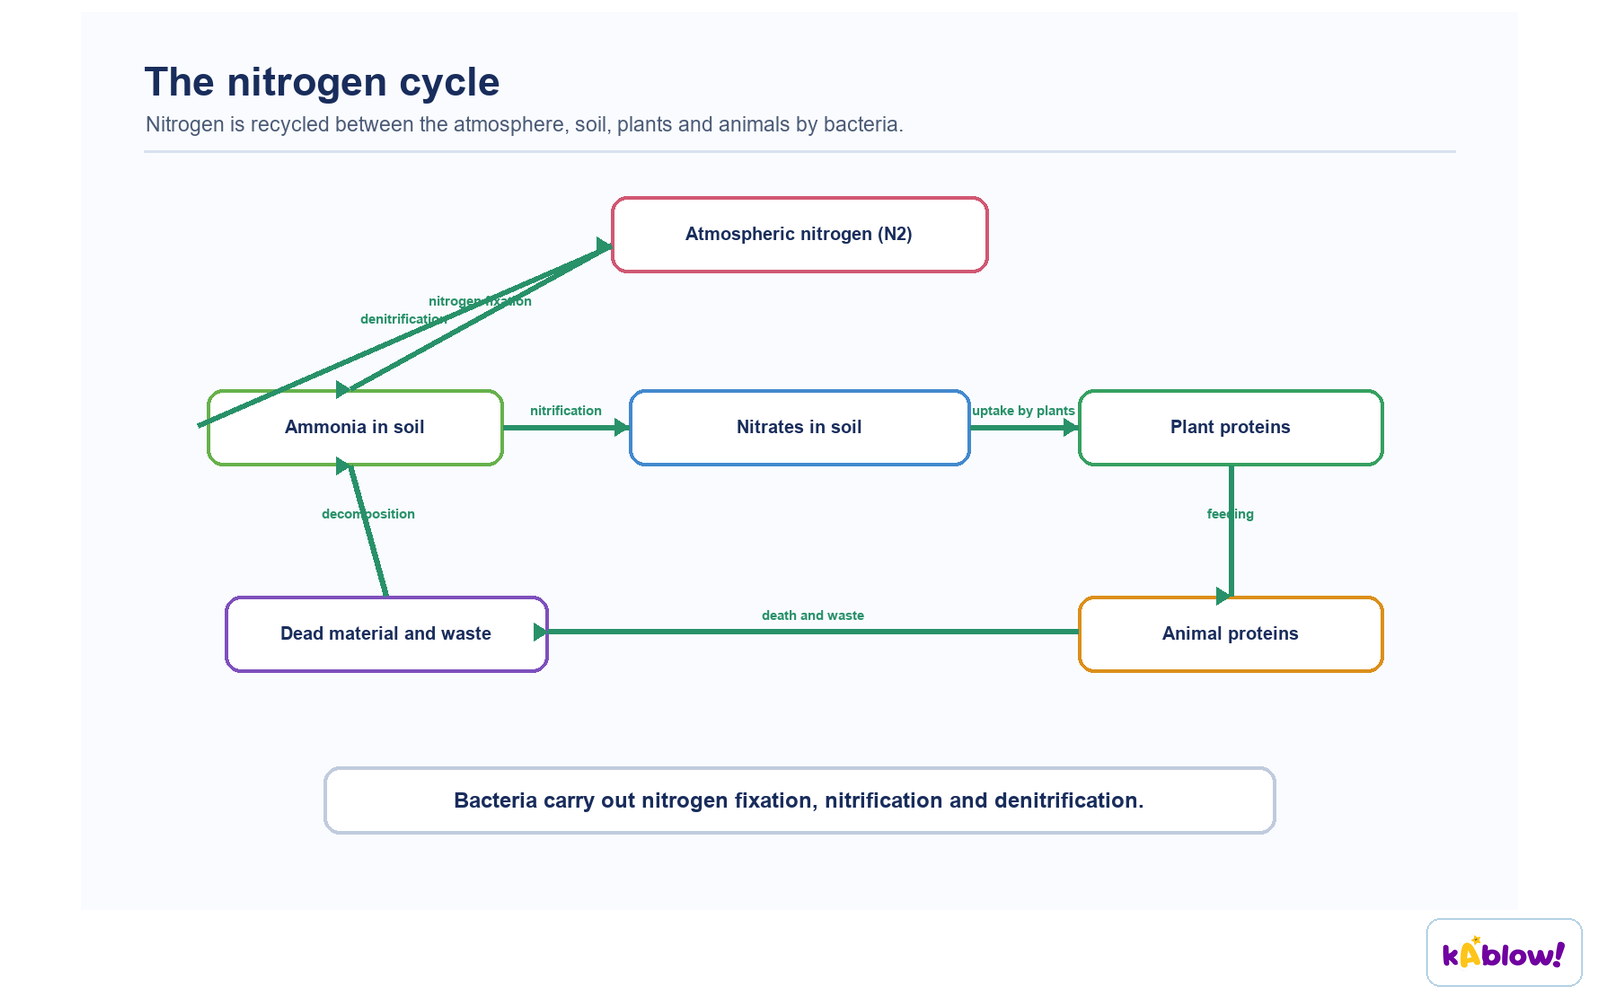
The Nitrogen Cycle (Extended)
- Nitrogen-fixing bacteria convert N₂ gas into ammonium compounds, which become nitrates.
- Nitrifying bacteria convert ammonium compounds to nitrites then nitrates.
- Plants absorb nitrates to build proteins; animals obtain nitrogen by eating plants.
- Decomposers break down dead organisms and waste into ammonium compounds.
- Denitrifying bacteria convert nitrates back to N₂ gas, reducing soil fertility.
The nitrogen cycle
Populations
- A population is a group of organisms of one species living in the same area at the same time.
- A community includes all populations of different species in an ecosystem.
- An ecosystem includes the community and its environment interacting together.
- Population growth is controlled by food supply, predation, and disease.
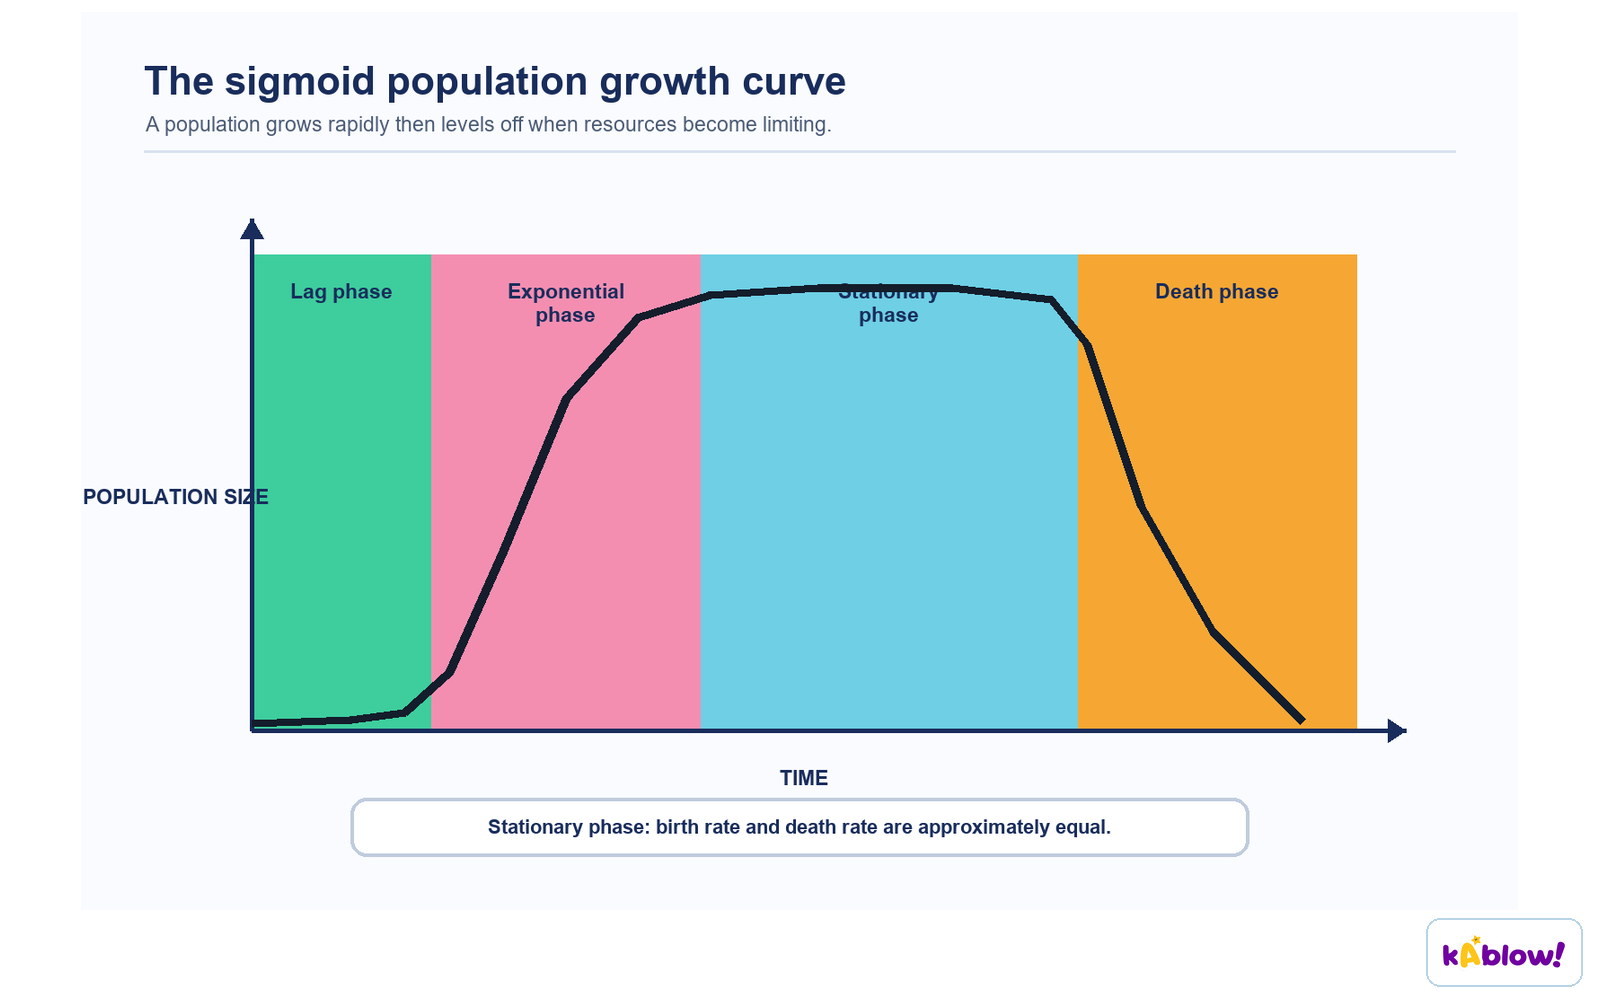
- The sigmoid growth curve has four phases: lag, log (exponential), stationary, and death.
- In natural environments, factors like temperature, light, predators, disease, immigration, and emigration affect growth.
The sigmoid population growth curve
Slides
Sign up free to view the lesson slides
Step through every slide for this topic — plus flashcards and revision notes — with a free account.
Practice questions
Free preview — 8 of 55 questions. Sign up to see them all.
1.Which of the following is a correct example of a population?
Easy- AAll the goldfish in a pond.
- BAll the animals in a forest.
- CAll the species of animals in Europe.
- DAll the people born in Scotland over a 150-year period.
2.Which process uses the principal source of energy input to biological systems?
Easy- APhotosynthesis
- BIngestion
- CDecomposition
- DRespiration
3.What is an example of a community?
Easy- AAll the populations of all species in a forest.
- BAll the goldfish in a pond.
- CAll the wheat and corn in a field.
- DAll the plants in a forest.
4.Which organism is a producer?
Easy- AGrass
- BRabbit
- CHawk
- DFungus
5.In the carbon cycle, which process describes carbon being passed from a producer to the animal that eats it?
Easy- APhotosynthesis
- BFeeding
- CRespiration
- DCombustion
6.Which of the following diagrams show a pyramid of biomass for a forest?
Medium- AA pyramid that is upright (wide base, narrow top)
- BA pyramid that is inverted (narrow base, wide top)
- CA pyramid that is rectangular (all bars same width)
- DA pyramid that is diamond-shaped (narrow base and top, wide middle)
7.A food chain is: tree → small insects → small birds → birds of prey. Which pyramid of numbers would be correct for this food chain?
Medium- AA pyramid with a narrow base (tree) and widening upwards
- BA pyramid with a wide base (tree) and narrowing upwards
- CA pyramid with a wide base (tree), then narrower, then wider, then narrower
- DA pyramid with equal width at all levels
8.Which statement gives the best explanation for why most food chains have no more than five trophic levels?
Medium- AThere is a large amount of energy loss at each level so insufficient energy can be passed up to the sixth trophic level.
- BBecause 20% of the energy is transferred at each level and after 5 levels, all the energy is used up (5 × 20% = 100%).
- CThe numbers of organisms are insufficient because the top predator has to have a count of 1 in a pyramid of numbers.
- DThe biomass transferred from a consumer to the next-level consumer is too little.
Unlock all 55 questions & more
Create a free account to see every question, the slides, flashcards and revision notes for this topic.