Variation
Learn it by playing
Answer these questions to earn energy, then fish and explore. No account needed.
Lesson notes
What is Variation?
- Variation is the diversity of shapes, sizes and colours seen in living things.
- Variation can be seen between different species and within the same species.
- Different species have different sets of genes, leading to distinct characteristics (e.g., birds have feathers, fish have scales).
- Individuals of the same species share many genes but have unique combinations causing differences like eye colour or height.
Continuous Variation
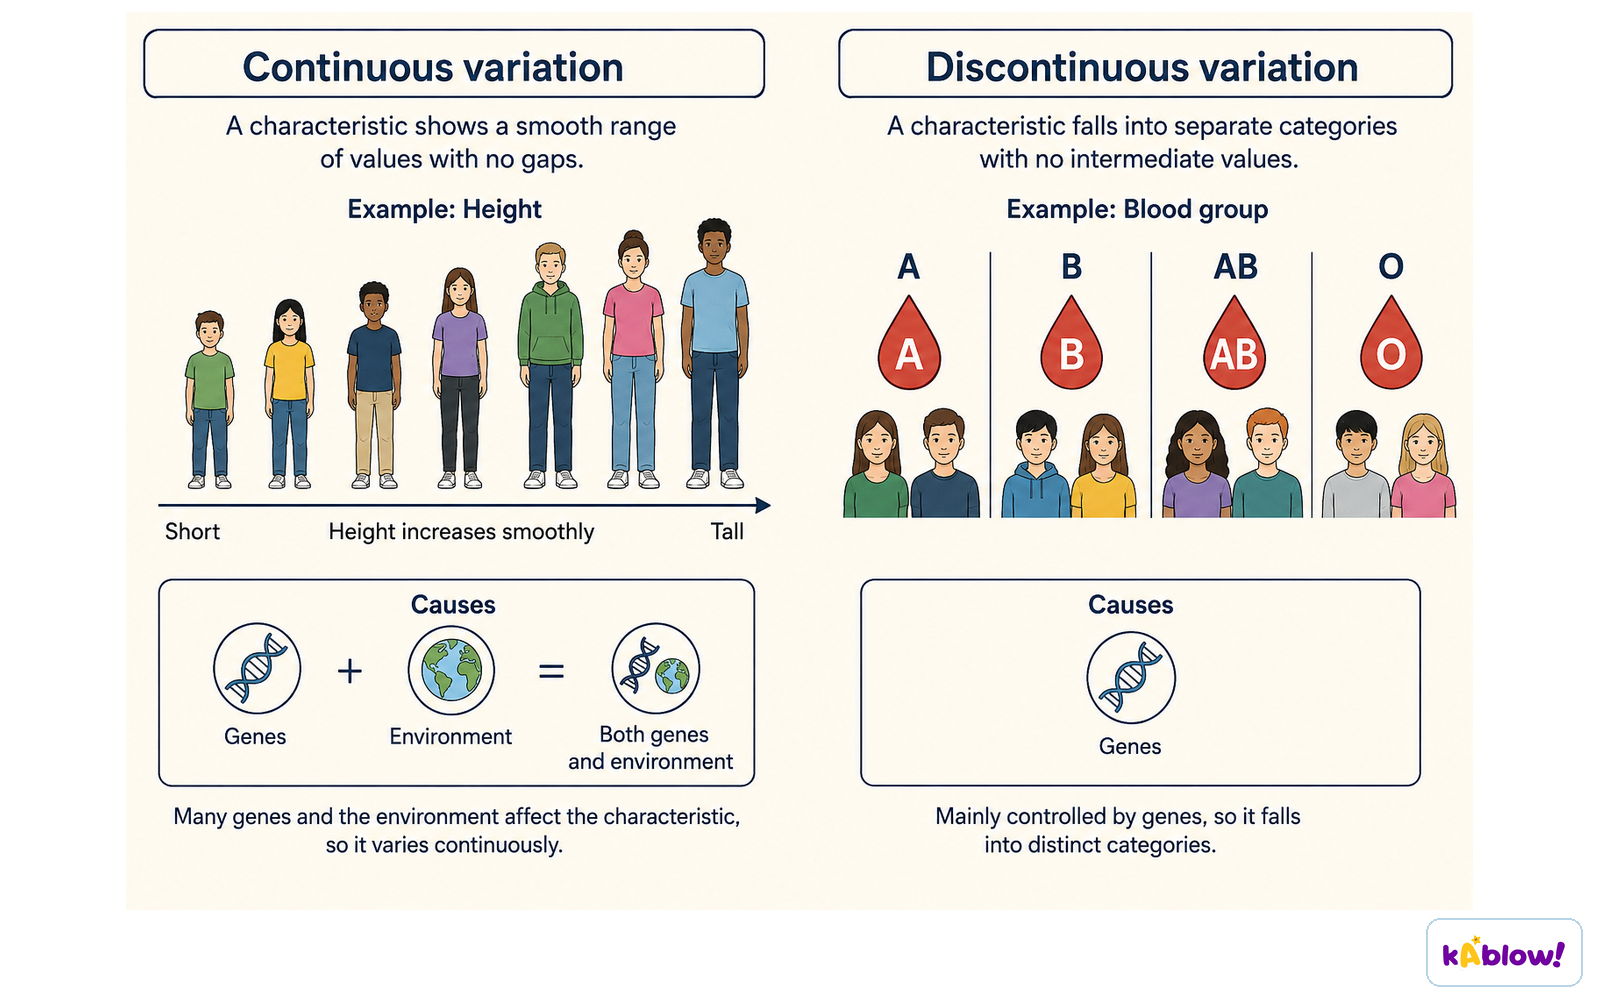
- Continuous variation shows a range of differences that gradually change with no clear divisions.
- Example: human height – people can be any height within a range, no fixed categories.
- Often represented using a histogram (e.g., distribution of heights of 155 year 9 students).
- Controlled by many genes (polygenic inheritance).
Height varies continuously across a range. ABO blood groups form distinct categories with no intermediate groups.
Discontinuous Variation
- Discontinuous variation has distinct categories with no intermediate forms.
- Example: blood type (A, B, AB, O) – you are one type, no in-between.
- Represented using a bar chart.
- Usually controlled by a small number of genes.
Examples of Variation
- Between species: birds vs fish – different genes produce feathers vs scales.
- Within species: human eye colour, height, hair type – each person is unique.
- Continuous: height, weight, skin colour.
- Discontinuous: blood type, ability to roll tongue, attached earlobes.
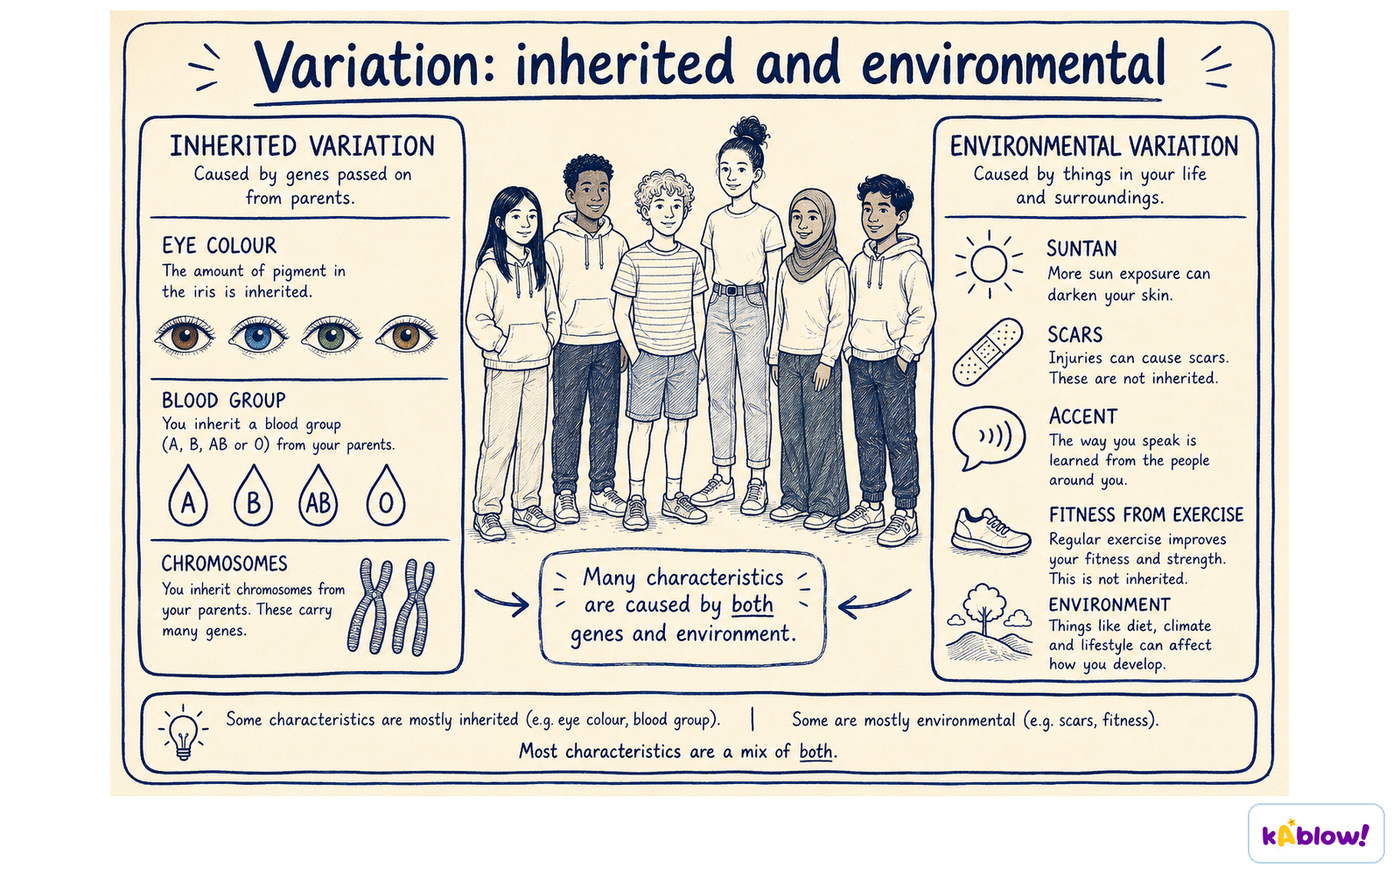
Inherited variation comes from genes. Environmental variation comes from surroundings and experiences; many characteristics are influenced by both.
Slides
Sign up free to view the lesson slides
Step through every slide for this topic — plus flashcards and revision notes — with a free account.
Practice questions
Free preview — 8 of 54 questions. Sign up to see them all.
1.Which of the following best defines variation in biology?
Easy- ADifferences between individuals of the same species only
- BDifferences between different species only
- CDifferences between individuals of different species and within the same species
- DDifferences that are always caused by the environment
2.Which of the following is an example of discontinuous variation?
Easy- AHeight
- BWeight
- CBlood type
- DSkin colour
- 3.Easy
Continuous variation is usually represented using which type of graph?
Type of graph Example use Bar chart Discontinuous variation Pie chart Proportions Line graph Change over time Histogram Continuous variation - ABar chart
- BPie chart
- CLine graph
- DHistogram
4.Which of the following statements about variation is true?
Medium- AIndividuals of the same species have identical genes.
- BDifferent species have the same sets of genes.
- CVariation within a species is what makes each individual unique.
- DVariation only occurs due to environmental factors.
5.A scientist measures the height of 200 students and finds a range from 140 cm to 190 cm with no clear categories. This is an example of:
Medium- ADiscontinuous variation
- BContinuous variation
- CGenetic variation only
- DEnvironmental variation only
6.Which of the following is NOT a characteristic of discontinuous variation?
Medium- AControlled by a small number of genes
- BShows distinct categories
- CCan be represented using a bar chart
- DShows a range of differences that gradually change
- 7.Medium
The table shows the distribution of heights of 150 year 8 students. Which height category has the highest number of students?
Height (cm) Number of students 130-139 30 140-149 46 150-159 40 160-169 34 Total 150 - A140-149 cm
- B150-159 cm
- C130-139 cm
- D160-169 cm
8.Which type of graph is most appropriate for representing discontinuous variation?
Easy- AHistogram
- BBar chart
- CLine graph
- DScatter plot
Unlock all 54 questions, flashcards & more
Create a free account to see every question, the slides, flashcards and revision notes for this topic.