
Rate Equations
Học bằng cách chơi
Trả lời những câu hỏi này để kiếm năng lượng, rồi câu cá và khám phá. Không cần tài khoản.
Ghi chú bài học
State which rate you are measuring
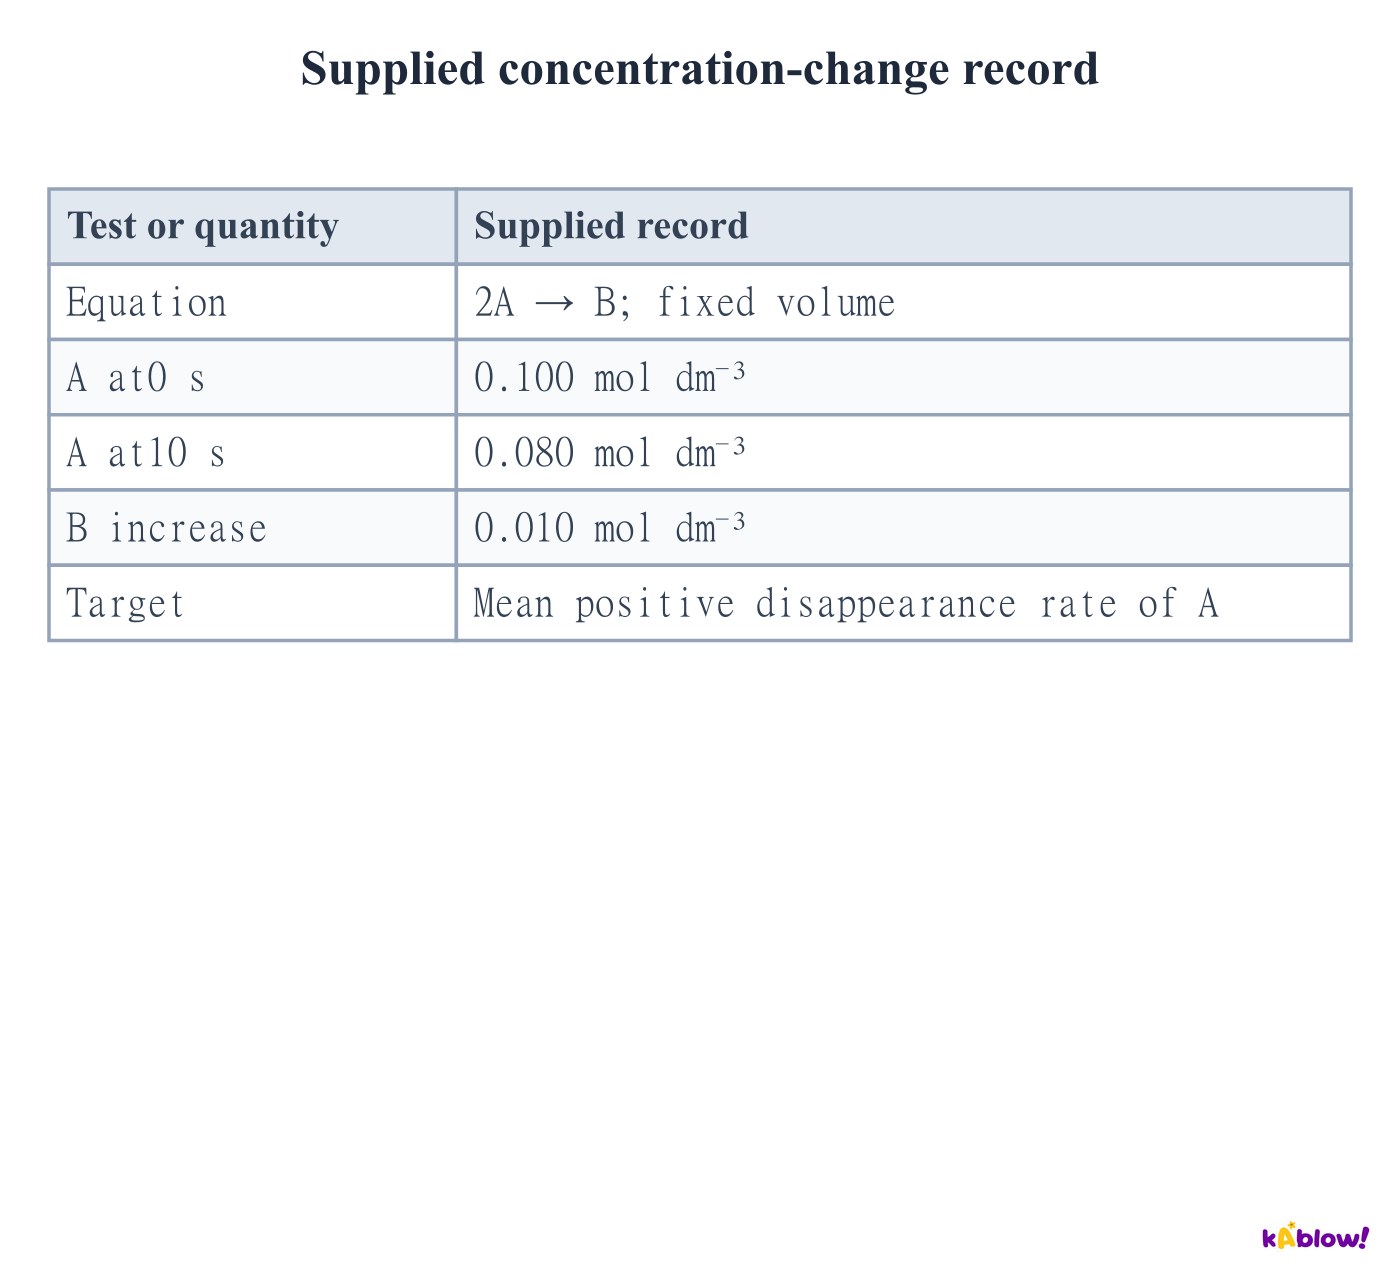
- A species disappearance rate is −Δ[A]/Δt and is positive when A decreases. A formation rate is +Δ[B]/Δt. State concentration and time units.
- For 2A→B at constant volume, disappearance of A is twice formation of B. The coefficient-normalised reaction rate is −½d[A]/dt=d[B]/dt.
- The supplied finite interval gives a mean rate. An instantaneous rate is obtained from a tangent at the chosen time.
Supplied concentration-change record
Read an empirical rate equation
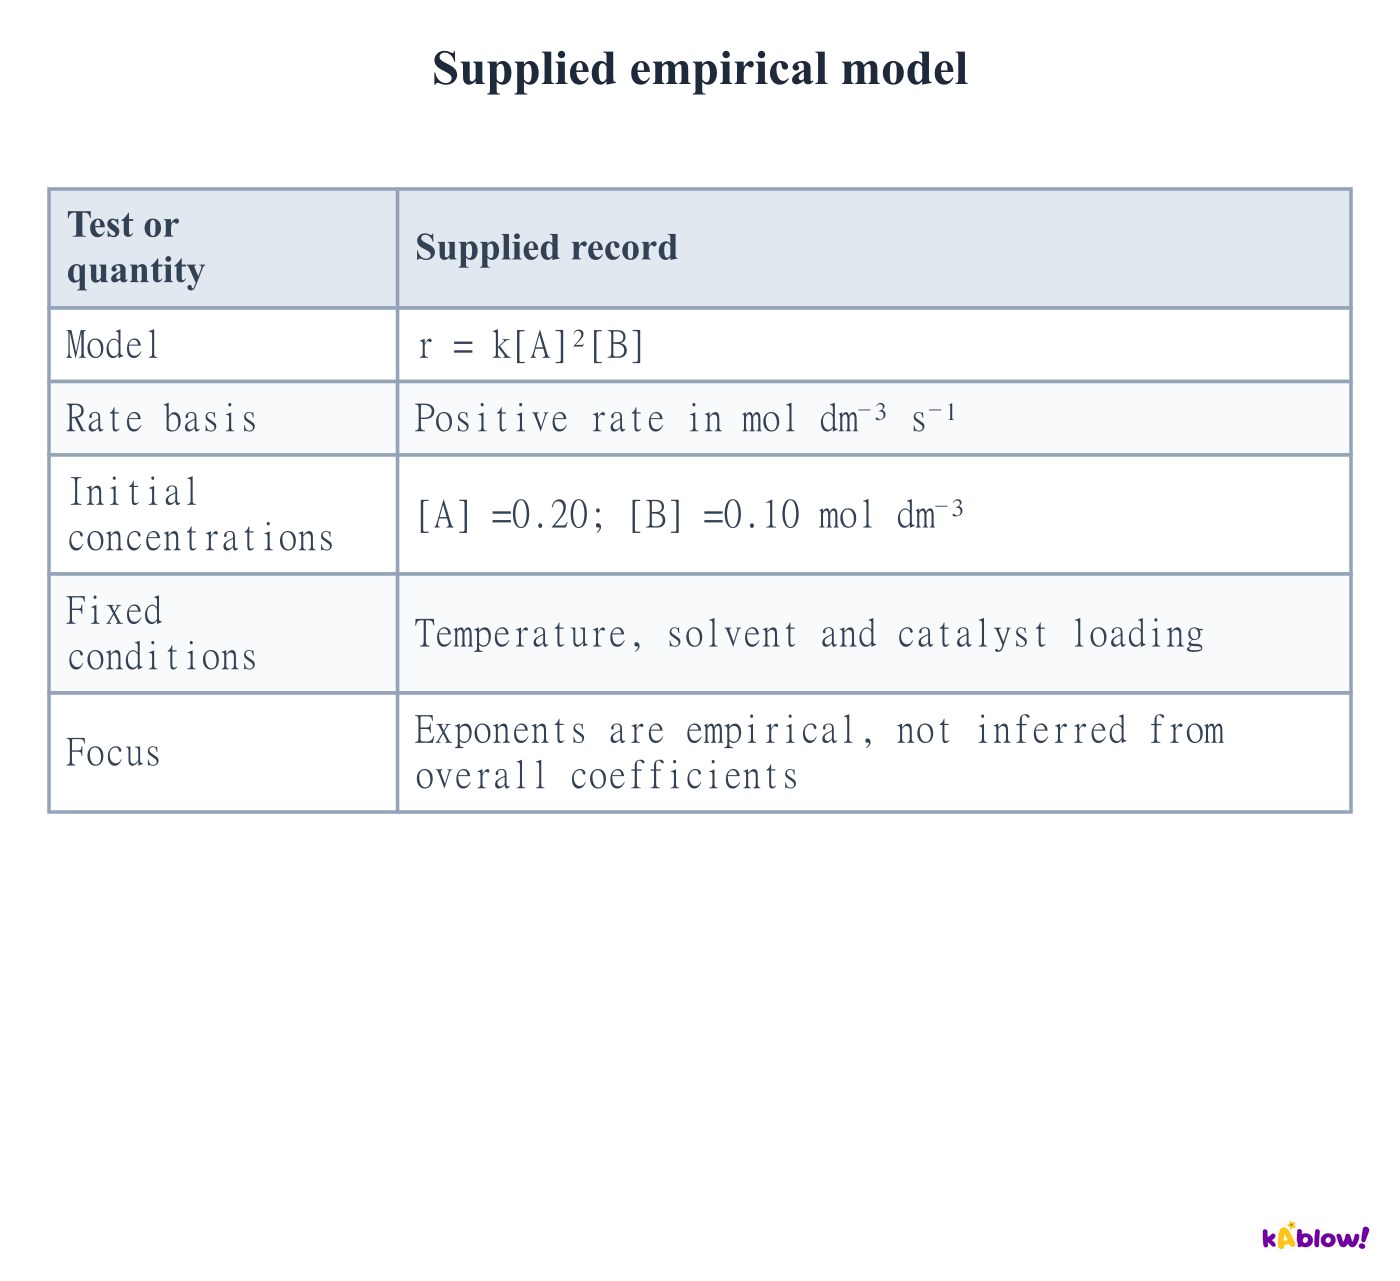
- In r=k[A]m[B]n, m and n are orders with respect to A and B. Overall order is m+n. Determine these exponents experimentally.
- The rate equation does not usually follow directly from overall reaction coefficients. AQA examples emphasise zero, first and second orders; other values occur in chemistry.
- For r=k[A]²[B], doubling A alone multiplies rate by four, while doubling B alone multiplies it by two. Use the same defined rate basis throughout.
Supplied empirical model
Recognise zero order from rate versus concentration
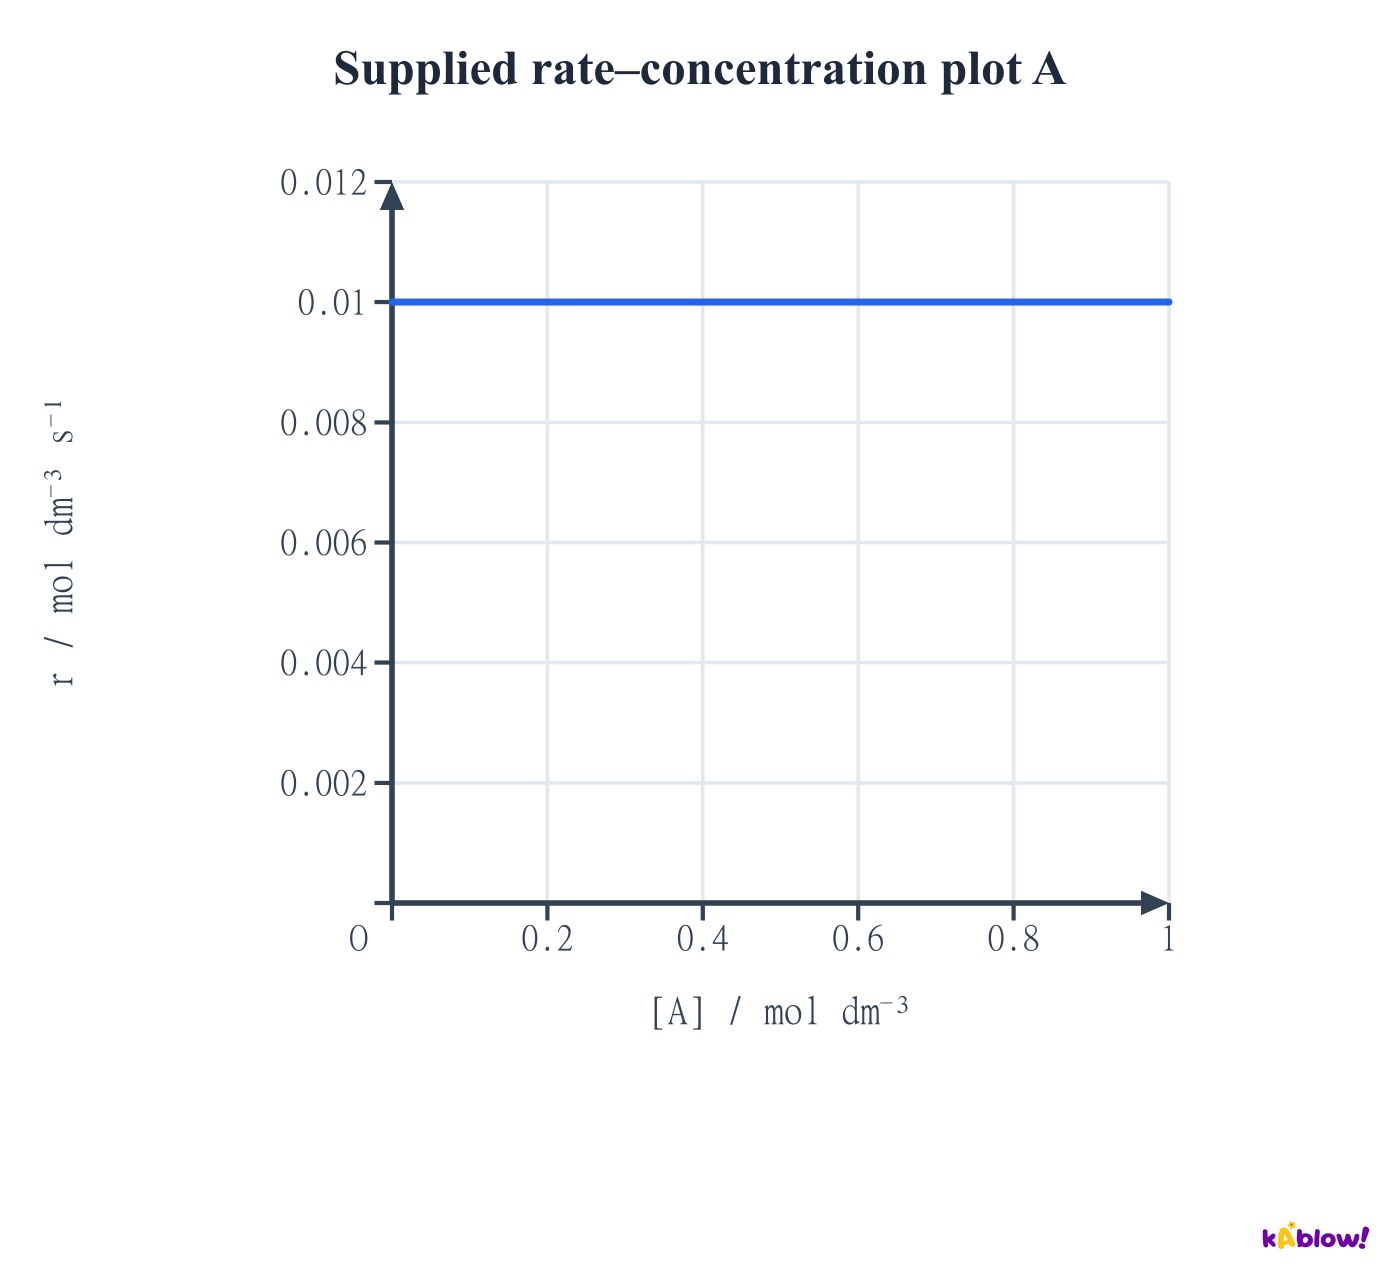
- A horizontal positive rate–concentration line shows that changing the plotted concentration does not change rate over the investigated range.
- The exponent for this species is zero: [A]⁰=1. This does not mean that A is absent from the overall chemical change.
- The model has a finite range. It cannot describe continued consumption after the reactant has run out.
Supplied rate–concentration plot A
Recognise first order from rate versus concentration
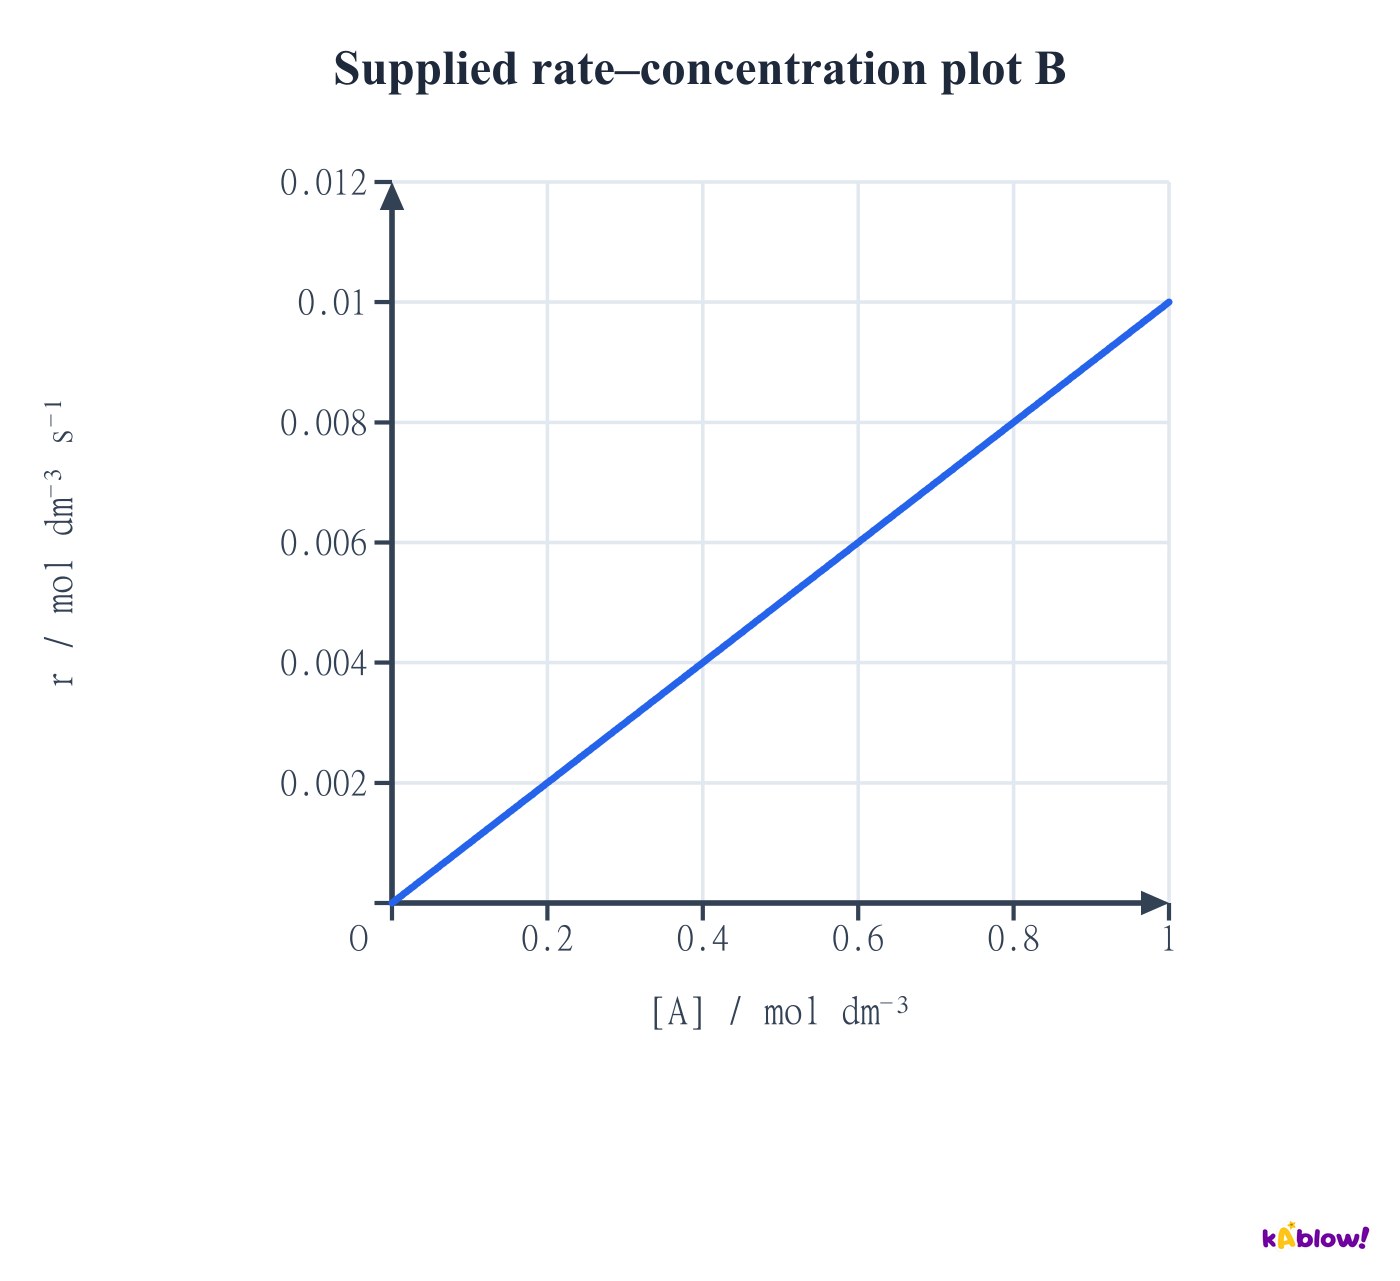
- A straight line through the origin on rate against concentration gives r proportional to[A] when other relevant concentrations and conditions are fixed.
- Doubling[A] doubles rate. The gradient equals the appropriate constant only after accounting for any other fixed concentration factors.
- Do not confuse this with concentration against time: a first-order concentration–time curve is exponential, not a straight line.
Supplied rate–concentration plot B
Recognise second order from rate versus concentration
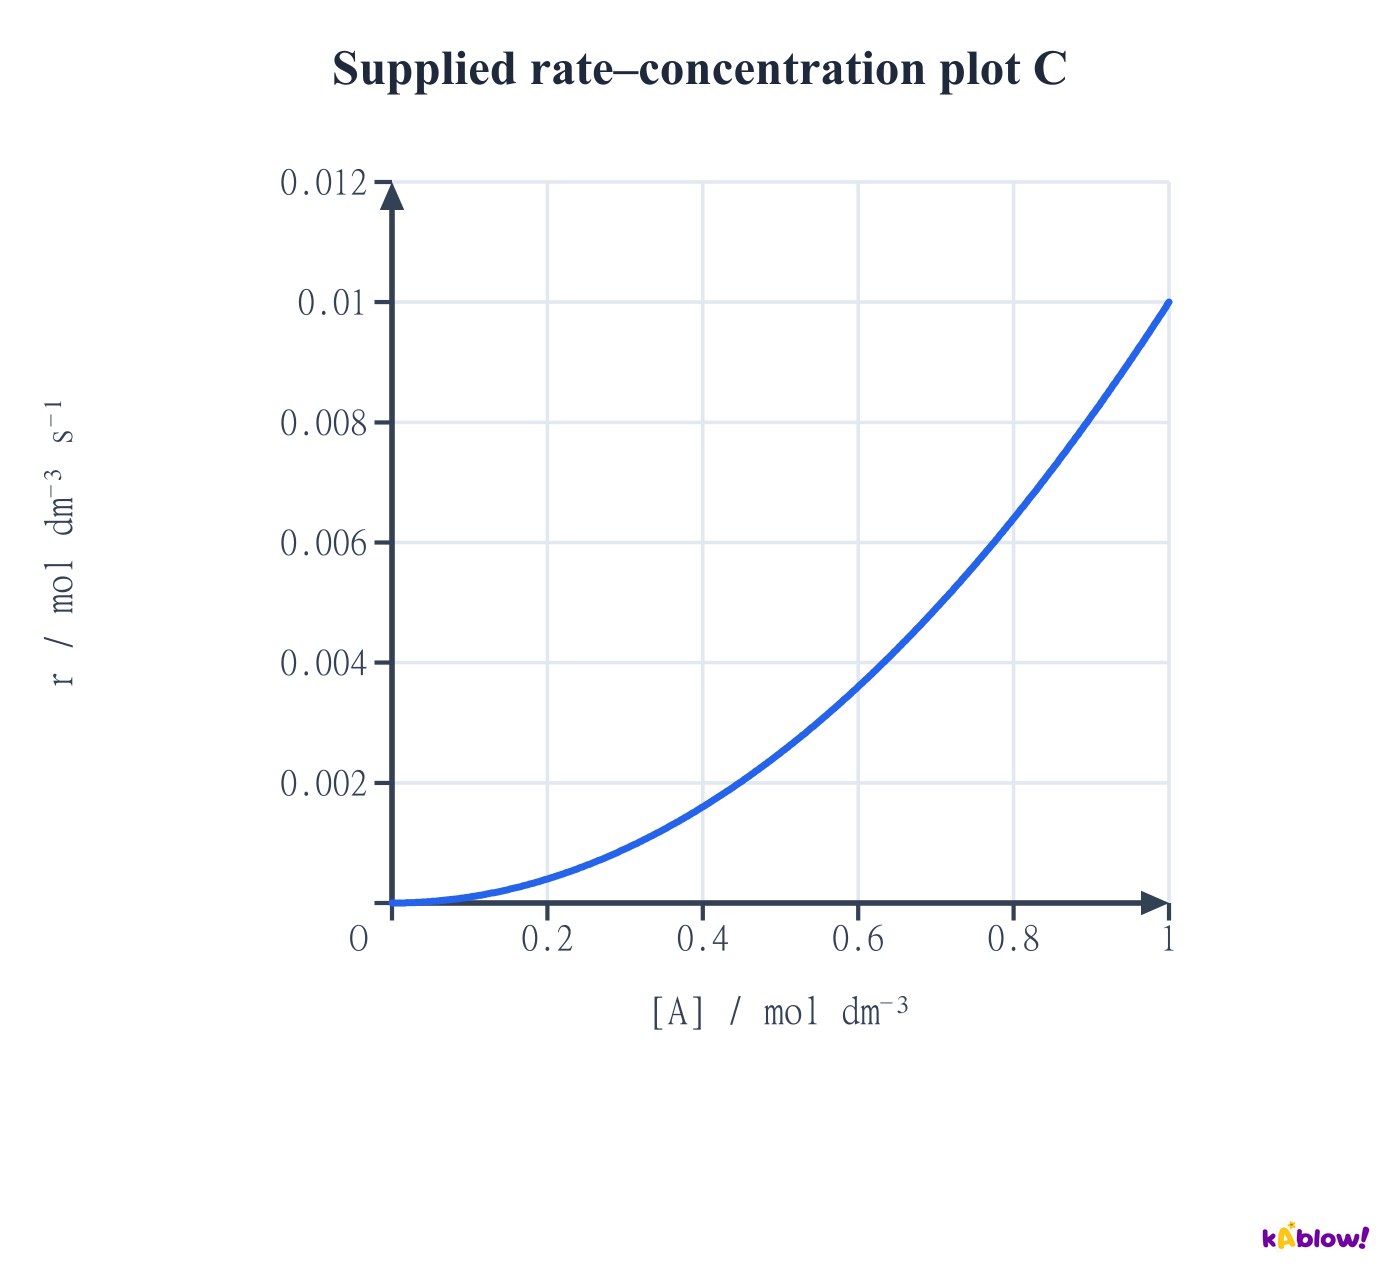
- For r=k[A]² with fixed conditions, rate against[A] is a quadratic curve through the origin. Doubling concentration multiplies rate by four.
- A plot of r against[A]² would be linear through the origin for this model.
- Always inspect both axes. A curved concentration–time trace alone does not establish second order merely because it looks steep.
Supplied rate–concentration plot C
Use controlled initial-rate comparisons
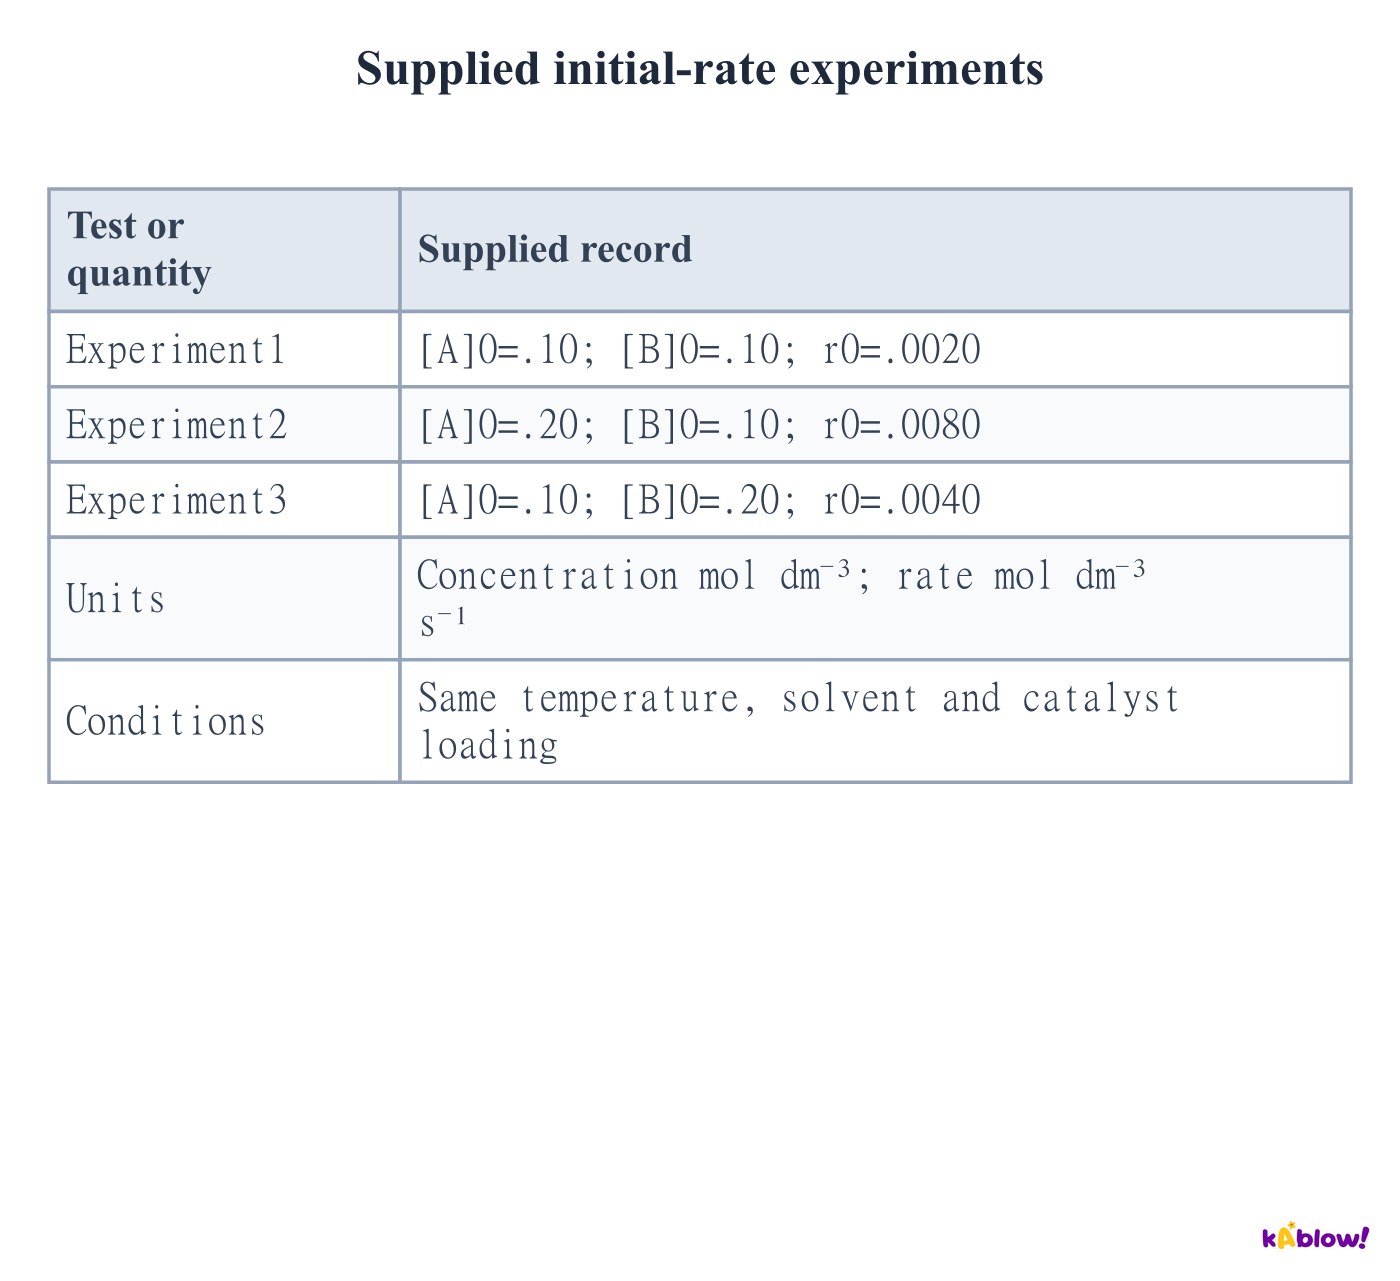
- Compare experiments1 and2: B is fixed while A doubles and rate quadruples. The order in A is two.
- Compare experiments1 and3: A is fixed while B doubles and rate doubles. The order in B is one, giving r=k[A]²[B].
- Temperature, solvent, total-volume effects and catalyst loading must be controlled. Initial concentrations refer to the mixed reaction solution.
Supplied initial-rate experiments
Identify when data cannot separate orders
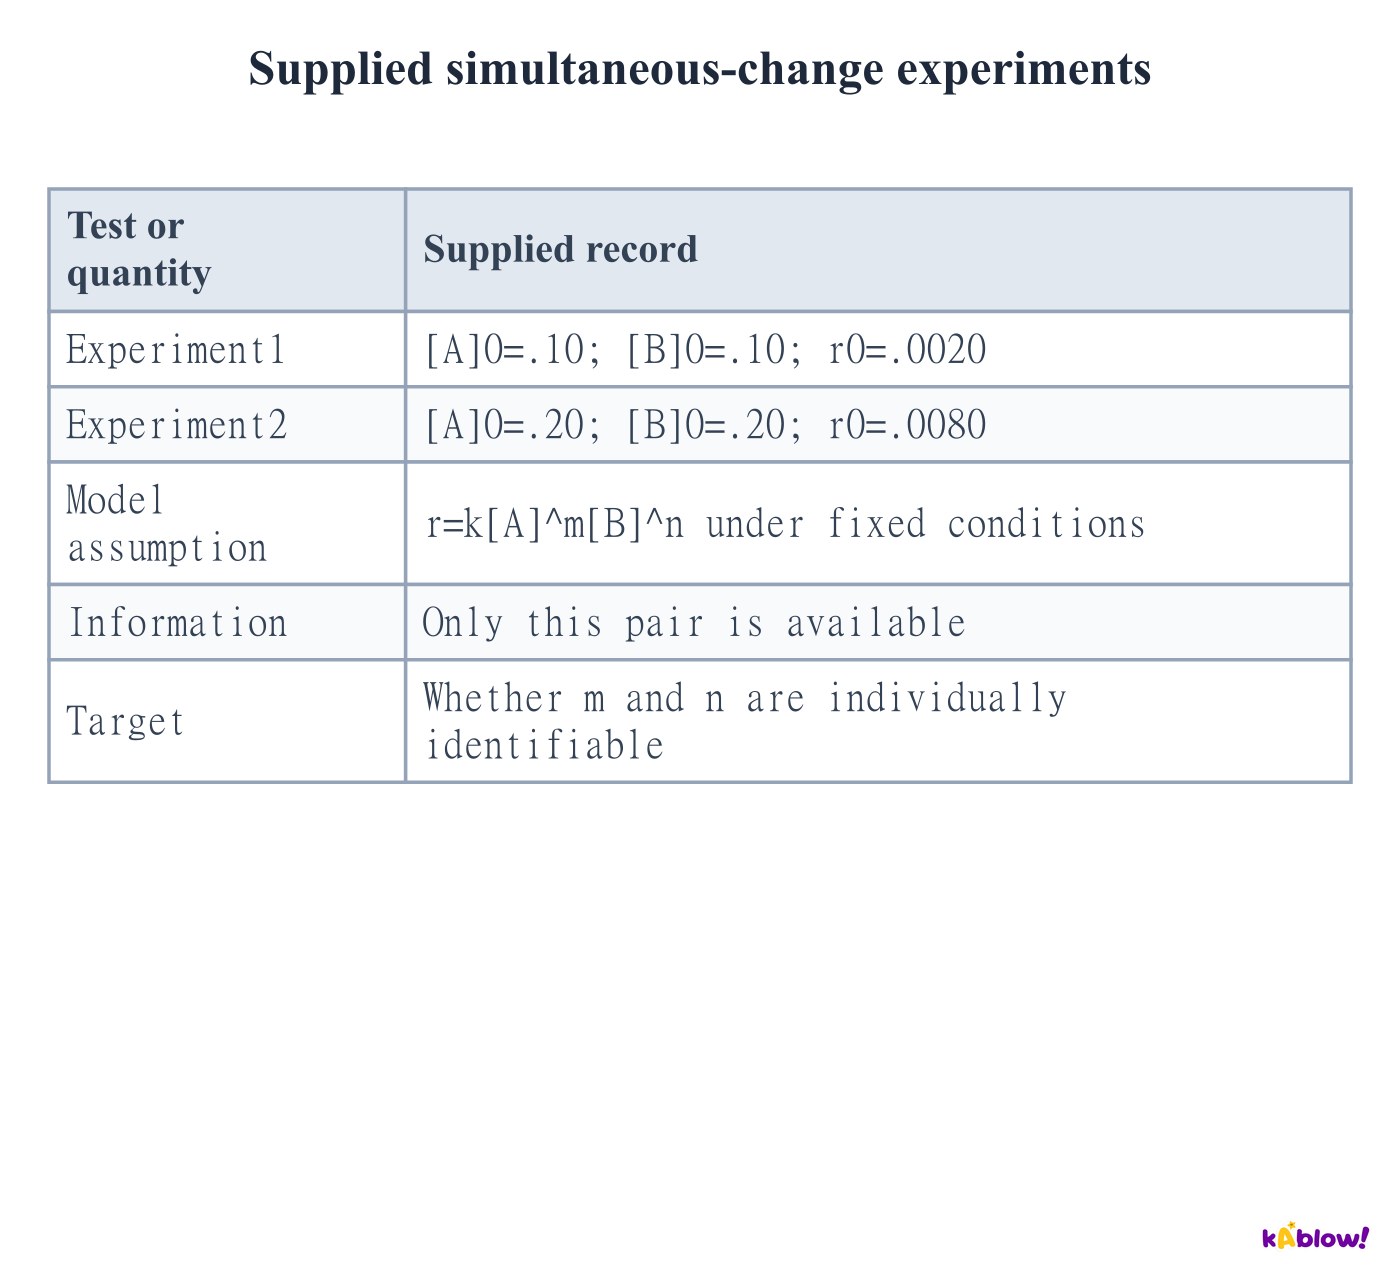
- If A and B both double and rate quadruples, the ratio equation is4=2m×2n. It constrains m+n=2.
- This pair alone cannot distinguish m=2,n=0 from m=1,n=1 or m=0,n=2.
- Simultaneous changes can still be analysed when enough independent experiments are supplied. Seek independent constraints rather than assuming every pair must change only one factor.
Supplied simultaneous-change experiments
Calculate k after determining the orders
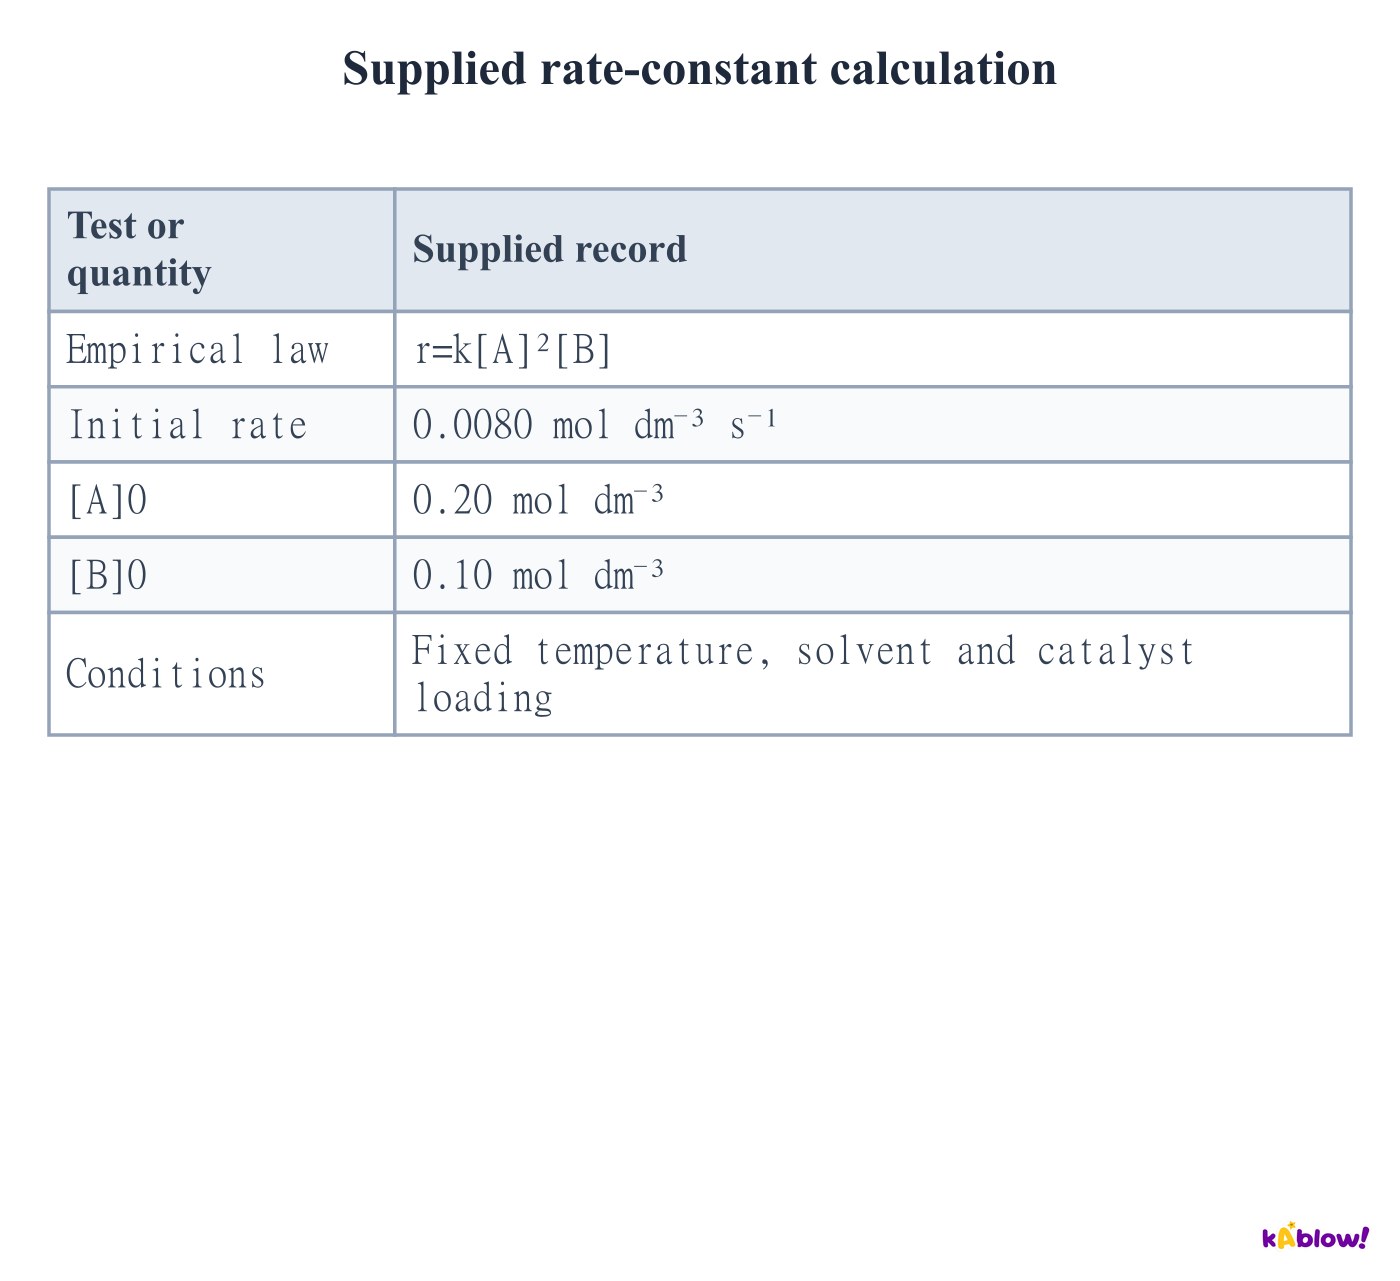
- Rearrange r=k[A]²[B] to k=r/([A]²[B]). Substitute mixed concentrations with consistent units.
- The supplied values give k=0.0080/(0.20²×0.10)=2.0 dm⁶ mol⁻² s⁻¹.
- Changing concentrations alone does not change k under the stated fixed conditions. Temperature, reaction medium or catalyst changes can change its measured value.
Supplied rate-constant calculation
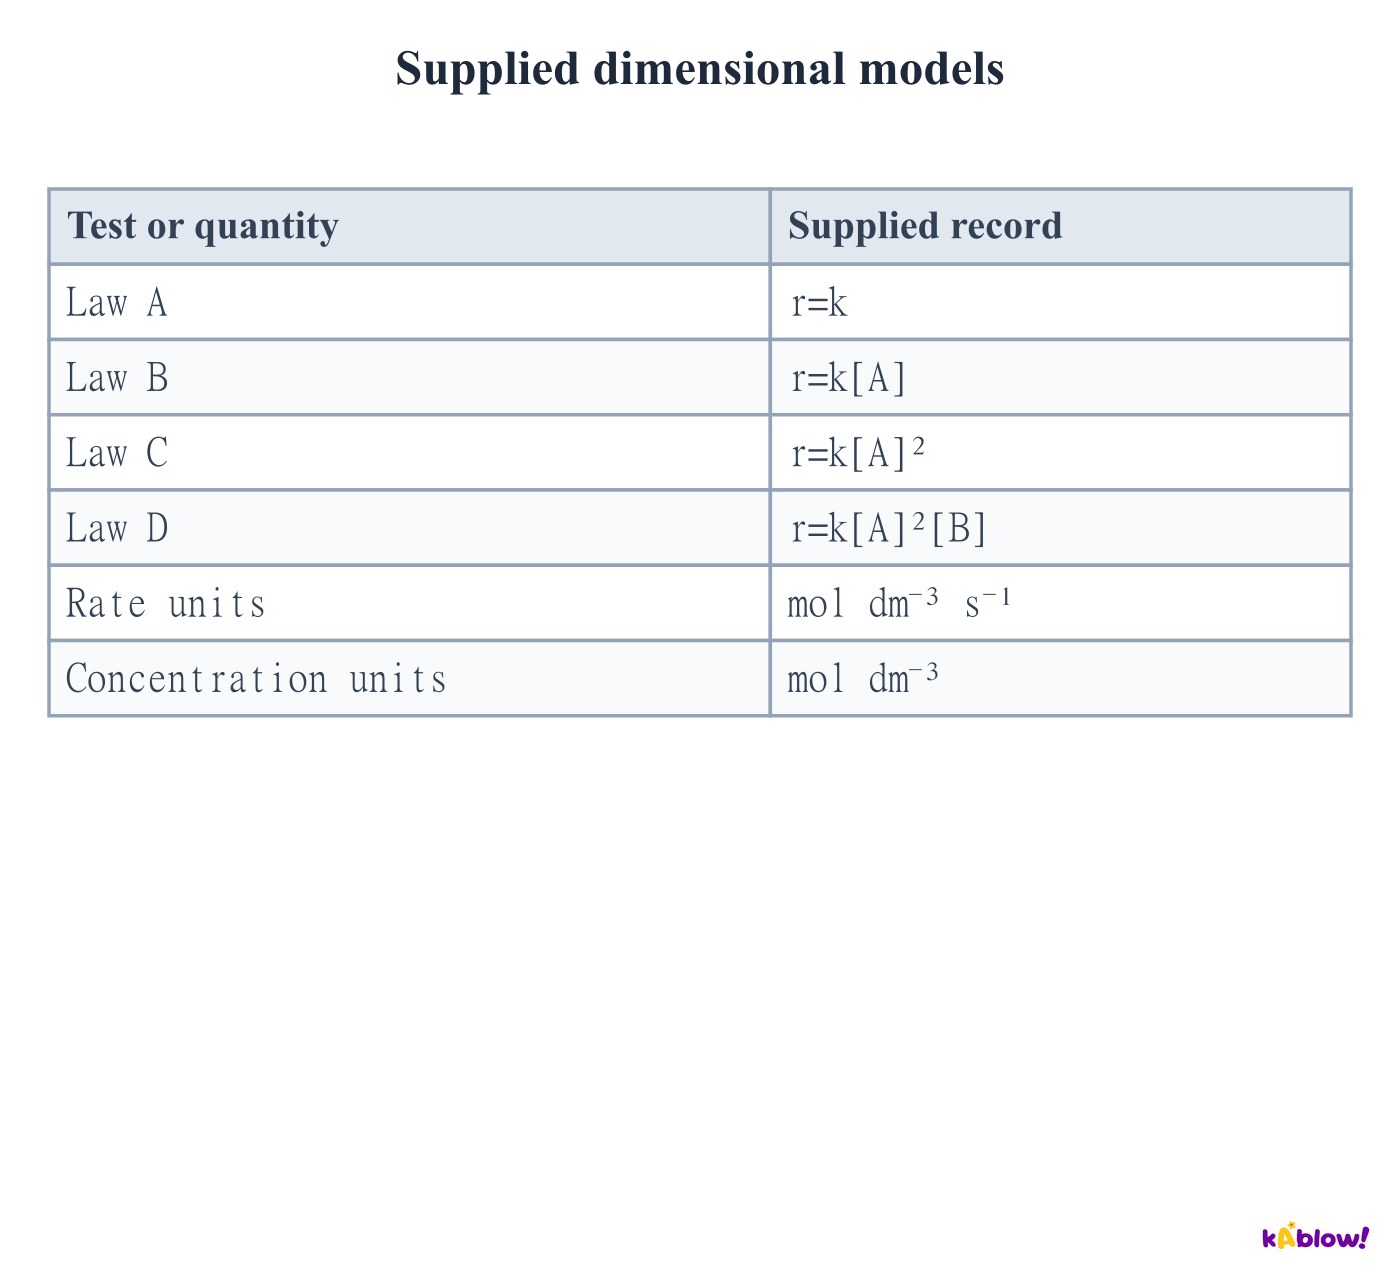
Derive rate-constant units
- Divide rate units by concentration units raised to the overall order. For order n, units are(concentration)^(1−n) time⁻¹.
- Zero-order k has mol dm⁻³ s⁻¹; first-order k has s⁻¹; second-order k has dm³ mol⁻¹ s⁻¹.
- Third-order k has dm⁶ mol⁻² s⁻¹. Numerical values change if different concentration or time units are used, so record units with k.
Supplied dimensional models
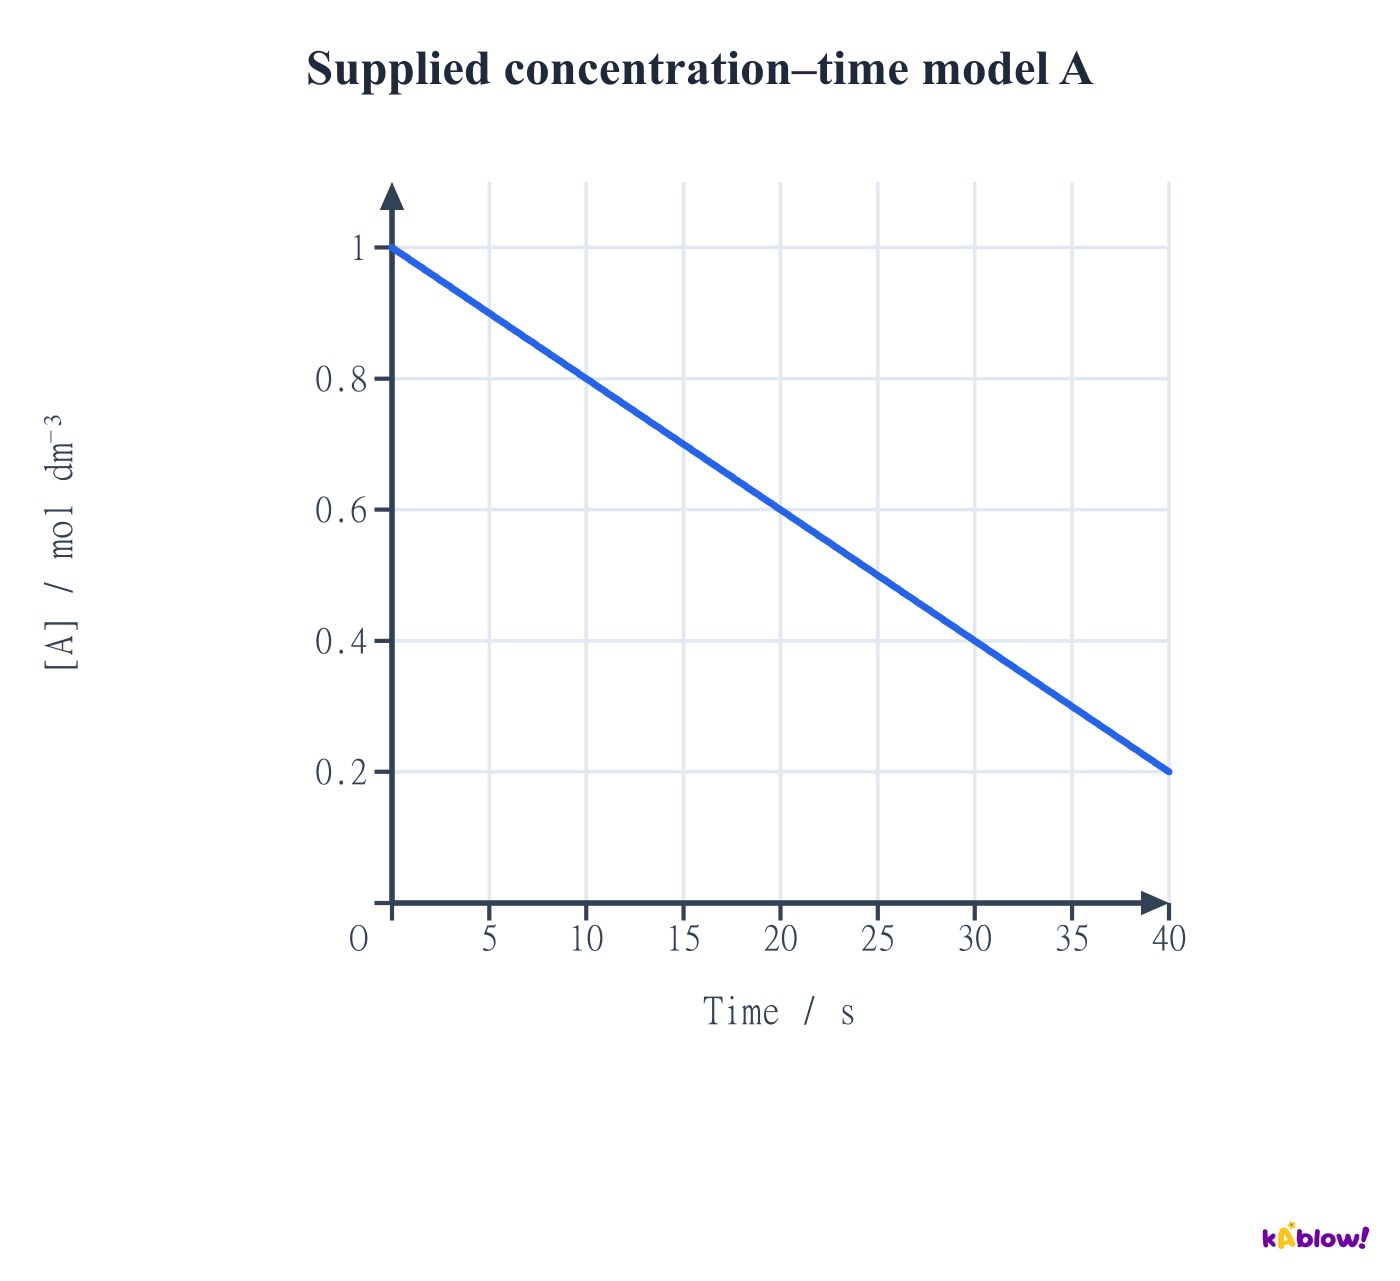
Read a linear concentration–time model
- For the simple disappearance law−d[A]/dt=k, concentration is[A]0−kt while reactant remains. The graph has constant negative gradient.
- Here[A]0=1.0 mol dm⁻³ and k=0.020 mol dm⁻³ s⁻¹. At40 s the concentration is0.20 mol dm⁻³.
- The model predicts depletion at50 s. It must not be extended to negative concentrations, and it is linear rather than inverse proportionality.
Supplied concentration–time model A
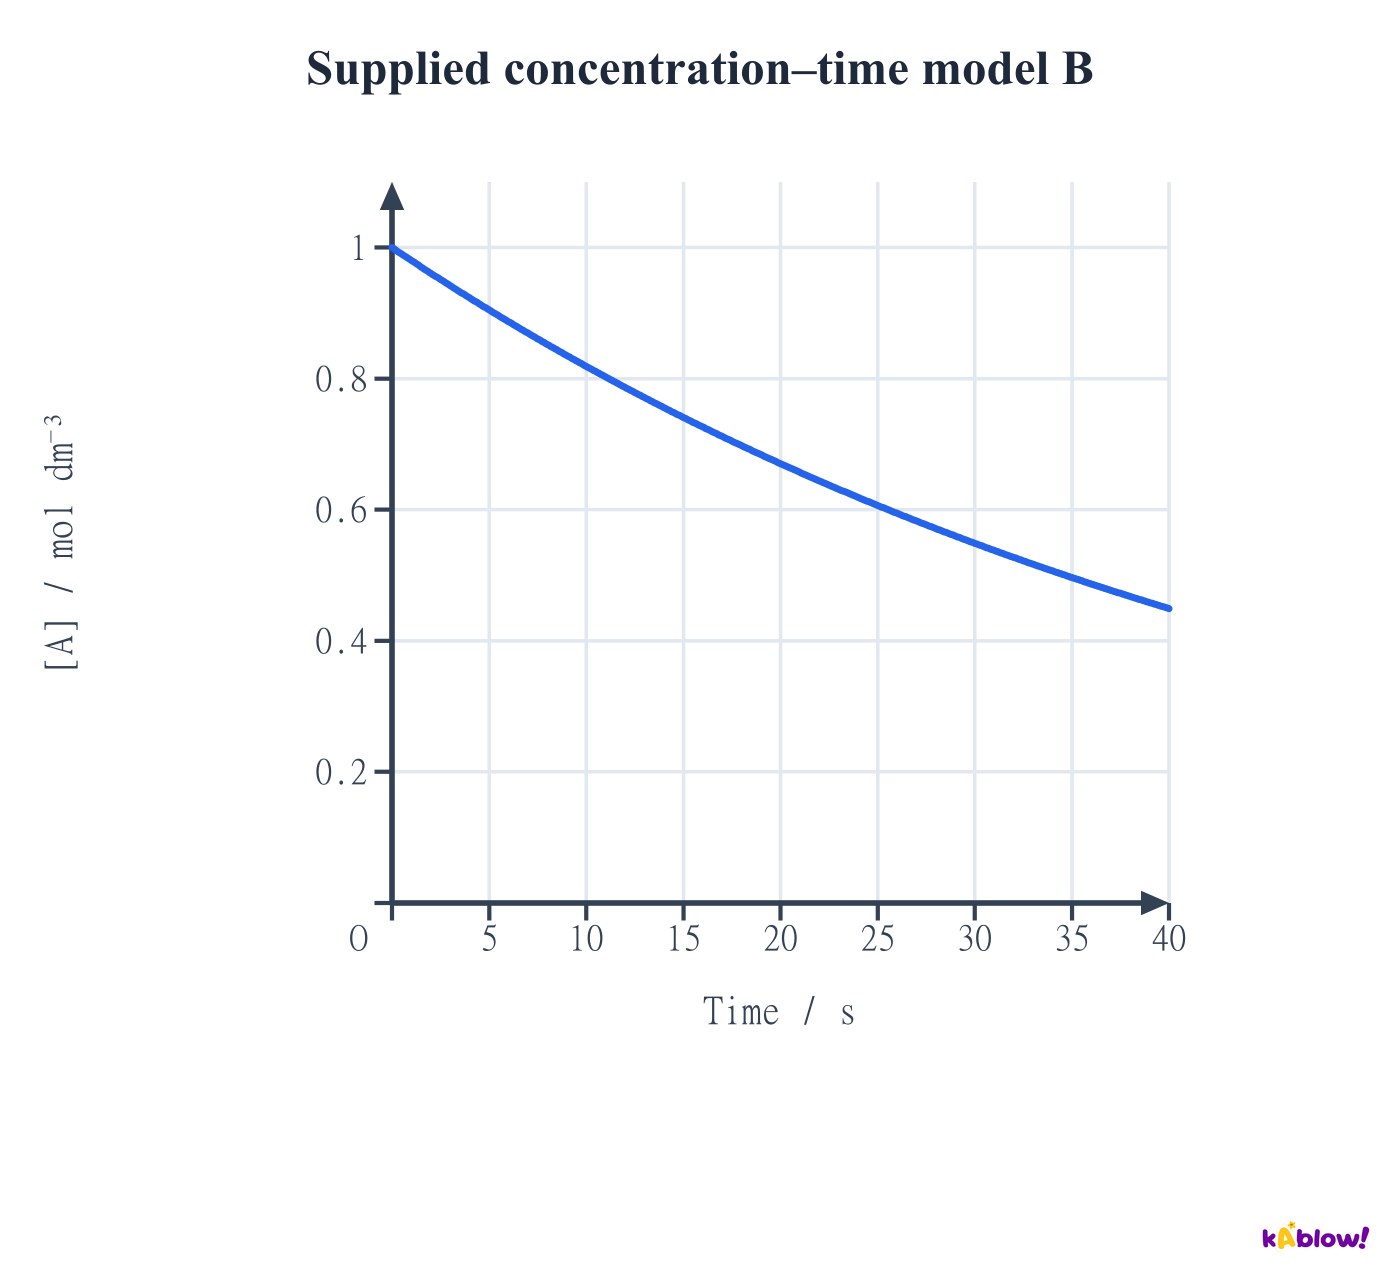
Read an exponential concentration–time model
- For−d[A]/dt=k[A], the simple one-reactant model gives[A]=[A]0 exp(−kt). The negative gradient becomes smaller in magnitude as A decreases.
- The supplied curve uses k=0.020 s⁻¹ and[A]0=1.0 mol dm⁻³. Its initial disappearance rate is0.020 mol dm⁻³ s⁻¹.
- Extension: successive concentration halvings take equal times in this model, t½=ln2/k. This is a model-specific diagnostic, not a universal property of reactions.
Supplied concentration–time model B
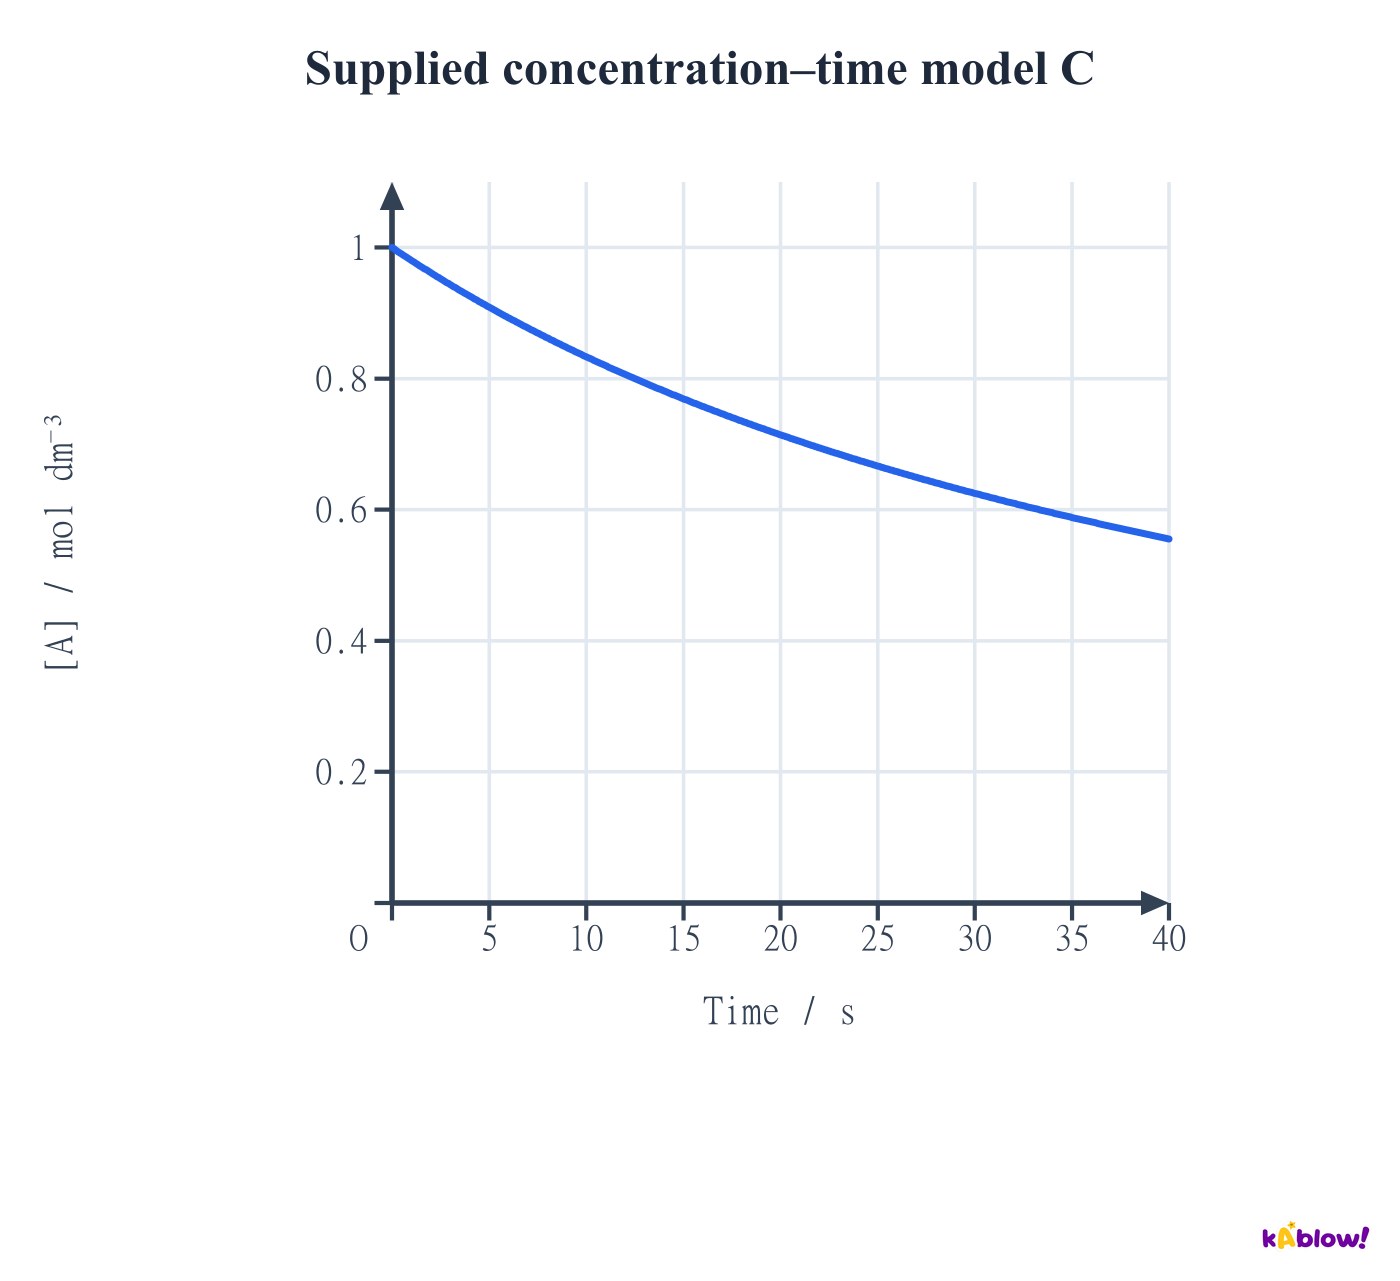
Compare concentration–time models fairly
- The simple second-order model−d[A]/dt=k[A]² gives[A]=[A]0/(1+k[A]0t). Here k=0.020 dm³ mol⁻¹ s⁻¹ and[A]0=1.0 mol dm⁻³.
- The supplied three time models share the same initial concentration and initial disappearance rate, while k has different units in each.
- Do not identify order from absolute steepness: initial concentrations, k and plot scales affect it. Use quantitative model tests or controlled rate–concentration data.
Supplied concentration–time model C
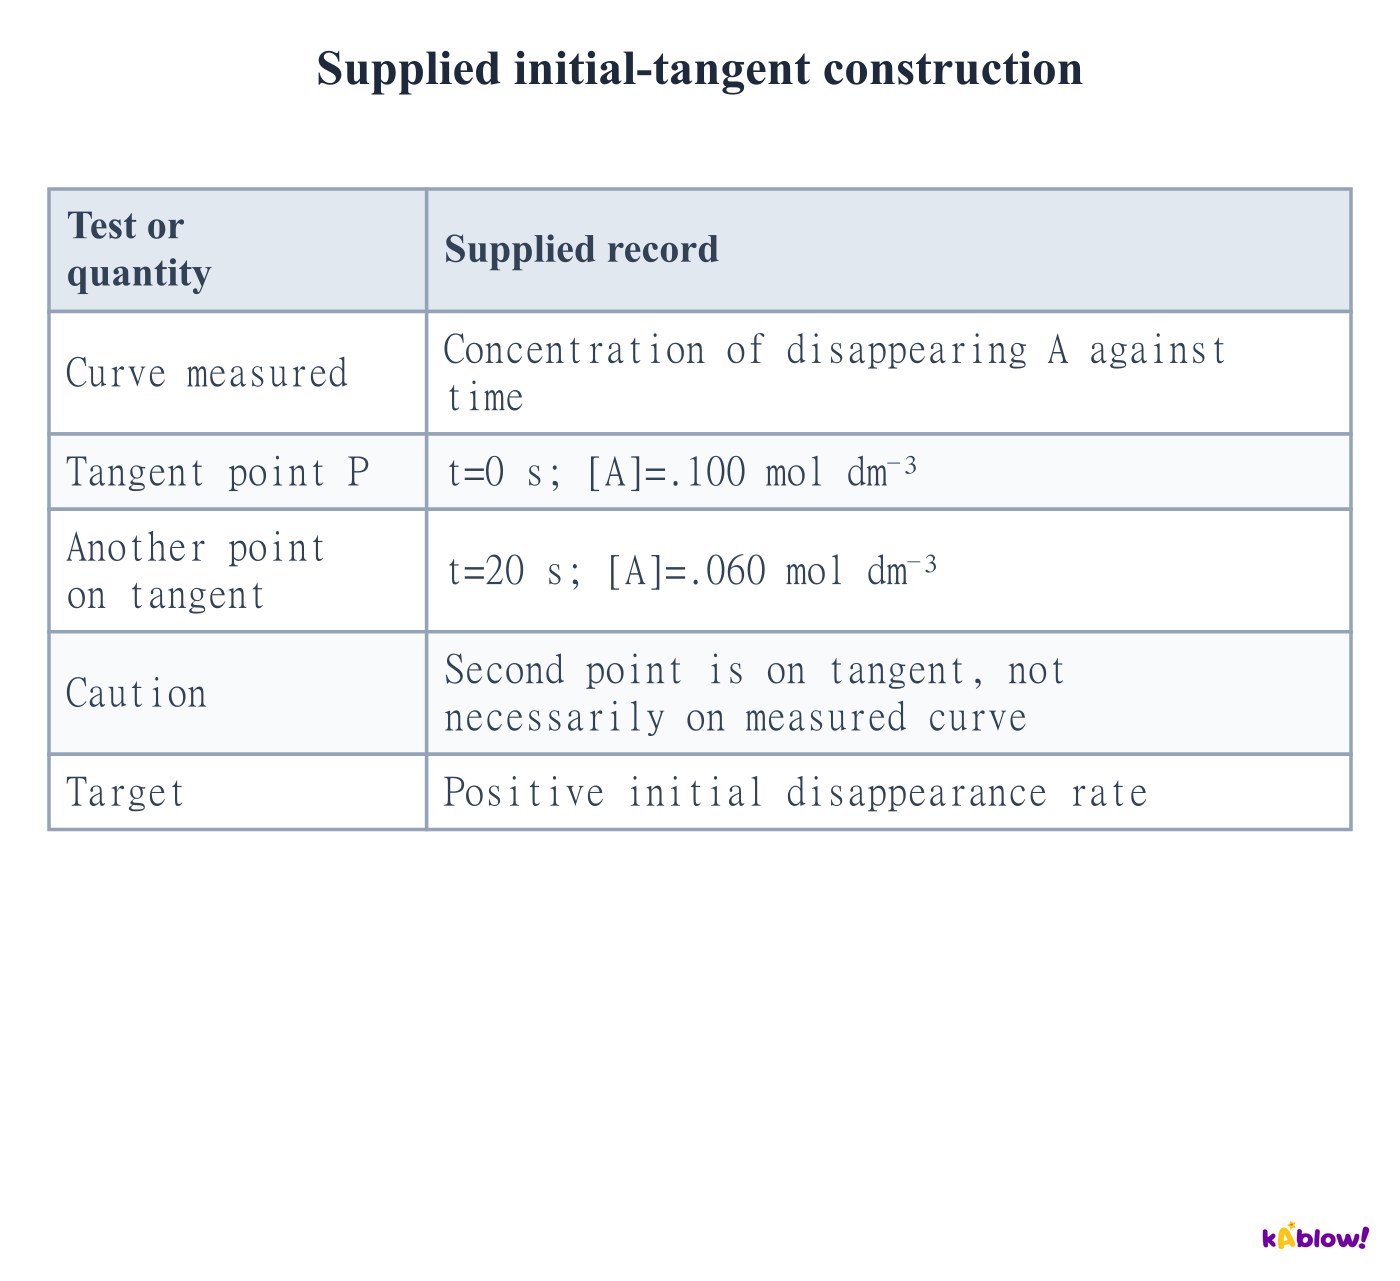
Find an initial rate from a tangent
- Draw a tangent to the measured concentration–time curve at t=0. Use widely separated readable points on that tangent to estimate its gradient.
- The supplied tangent slope is(0.060−0.100)/(20−0)=−0.0020 mol dm⁻³ s⁻¹, so the positive disappearance rate is0.0020 mol dm⁻³ s⁻¹.
- A secant over a finite reaction interval gives an average rate. Mixing delay and early measurement uncertainty affect an initial tangent estimate.
Supplied initial-tangent construction
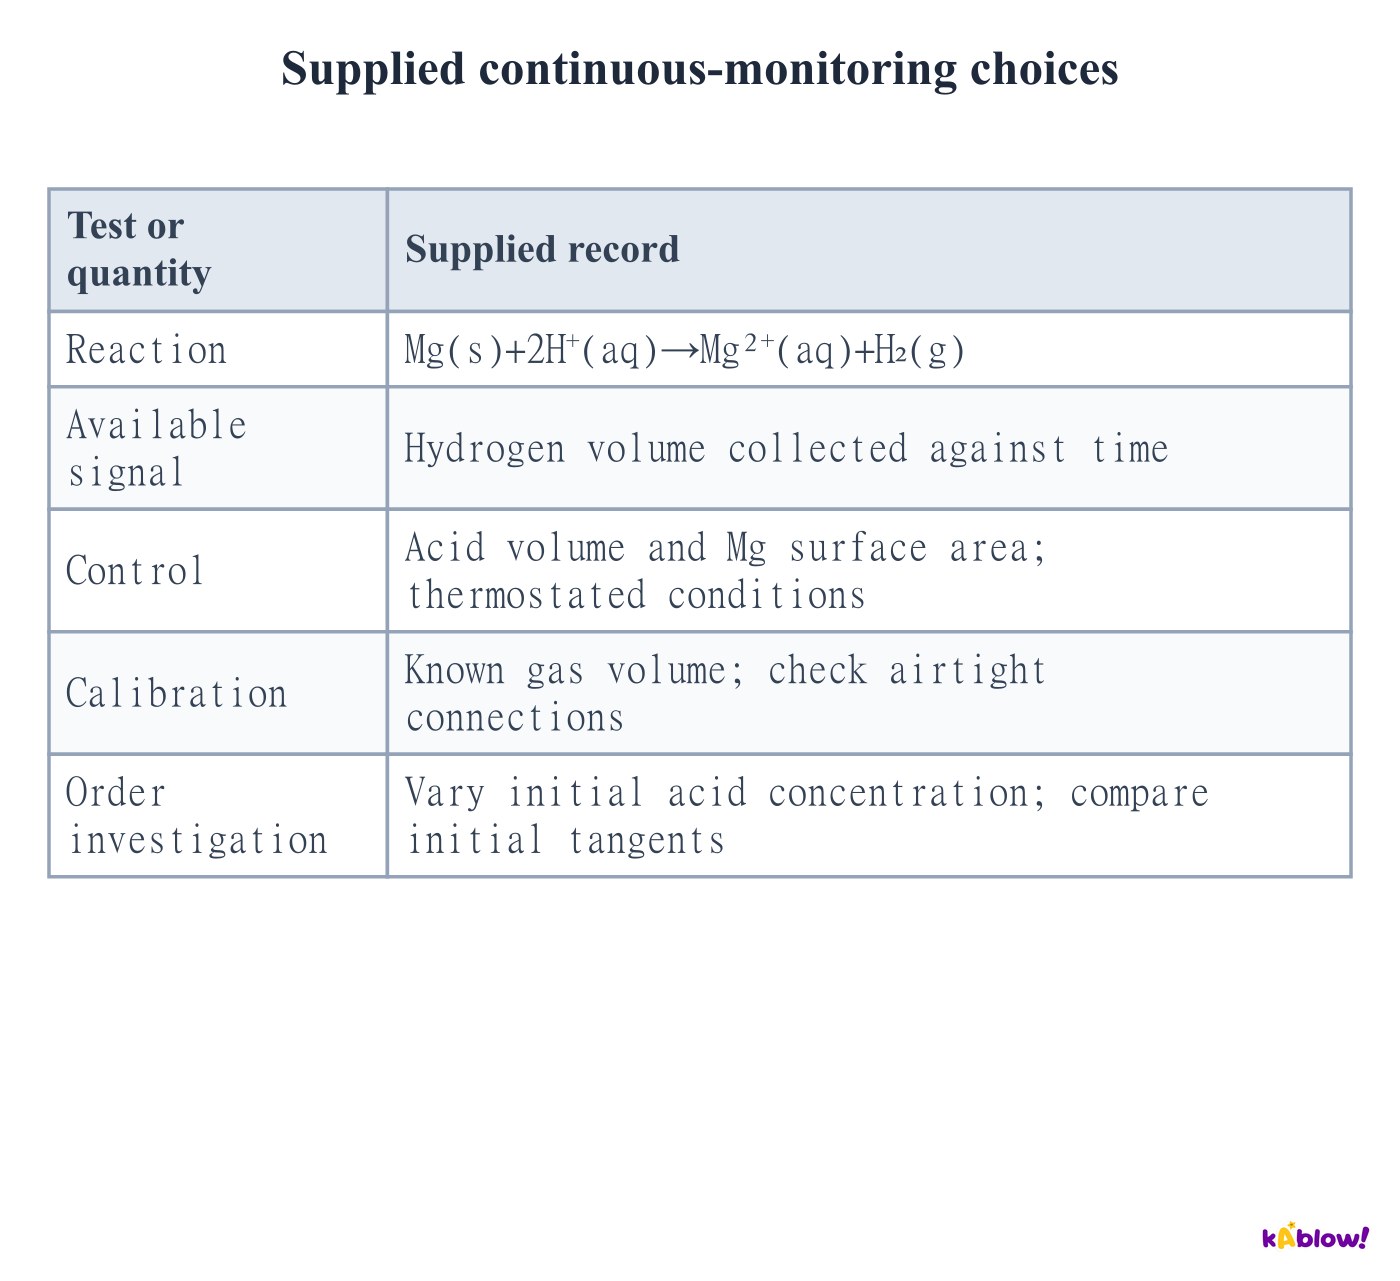
Plan continuous monitoring for required practical7
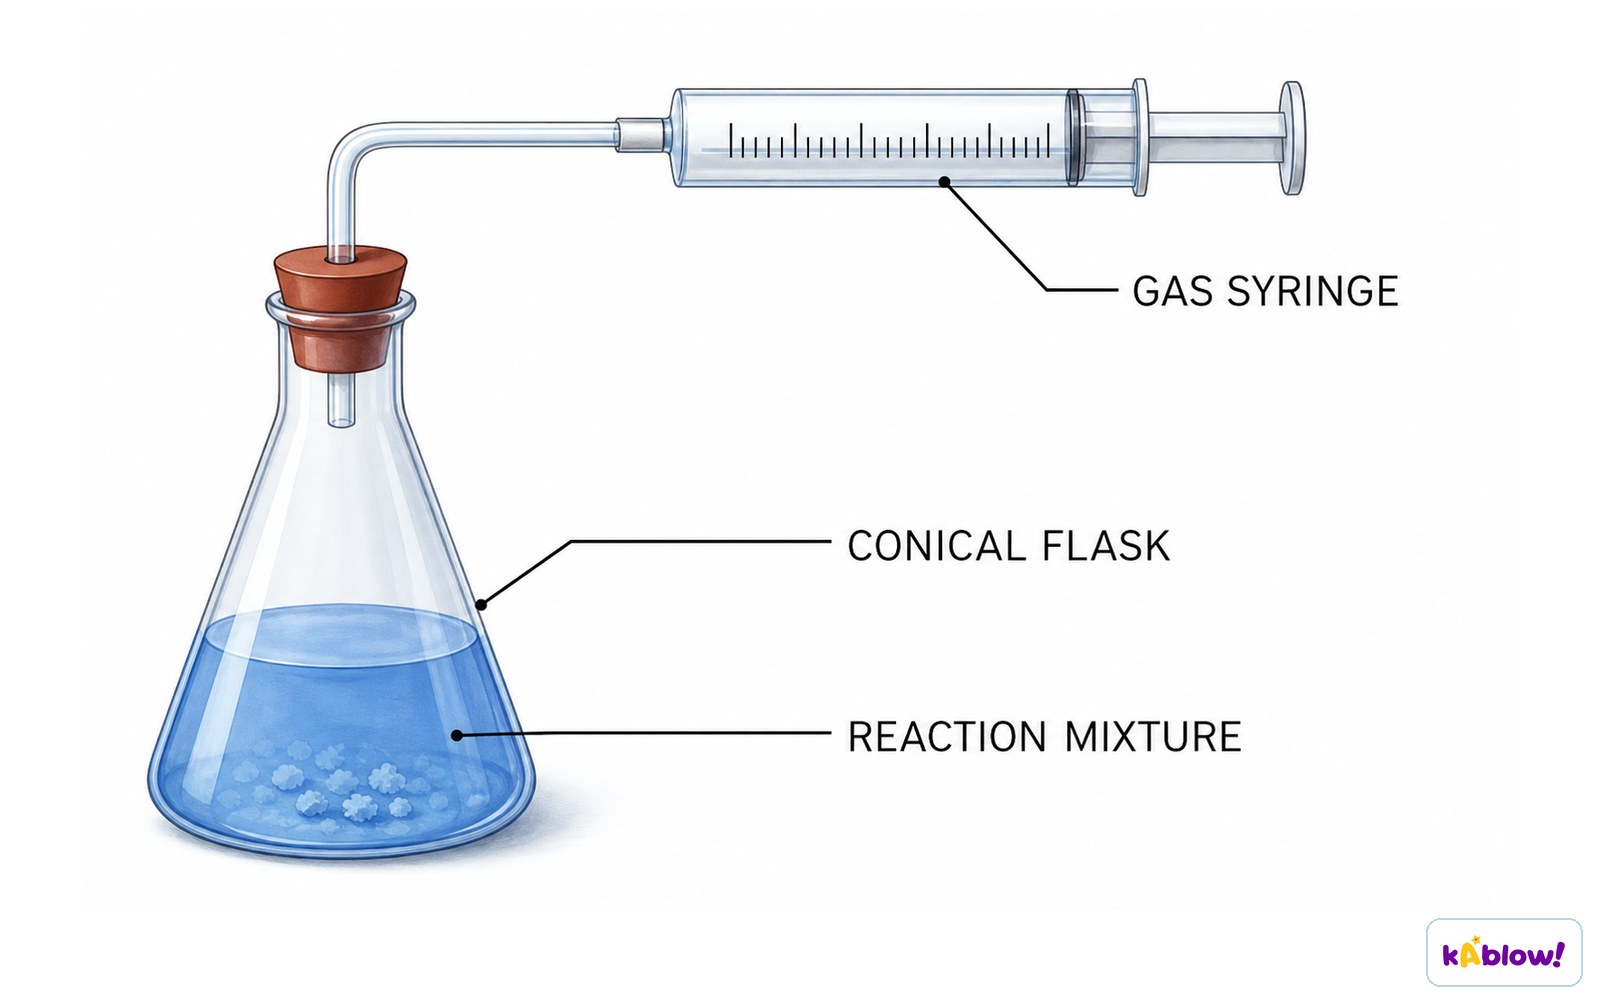
- Choose a signal that tracks reaction progress, such as gas volume, mass loss, colour or concentration. Relate signal change to the species or reaction rate being reported.
- For Mg and acid, an airtight gas syringe can monitor hydrogen formation. Compare initial tangents across measured initial acid concentrations.
- Keep magnesium surface area, acid volume and temperature controlled. Check gas leaks, syringe friction, mixing and timing; follow the practical risk assessment for acid and flammable hydrogen.
Record gas volume over time
Use a small fixed clock endpoint
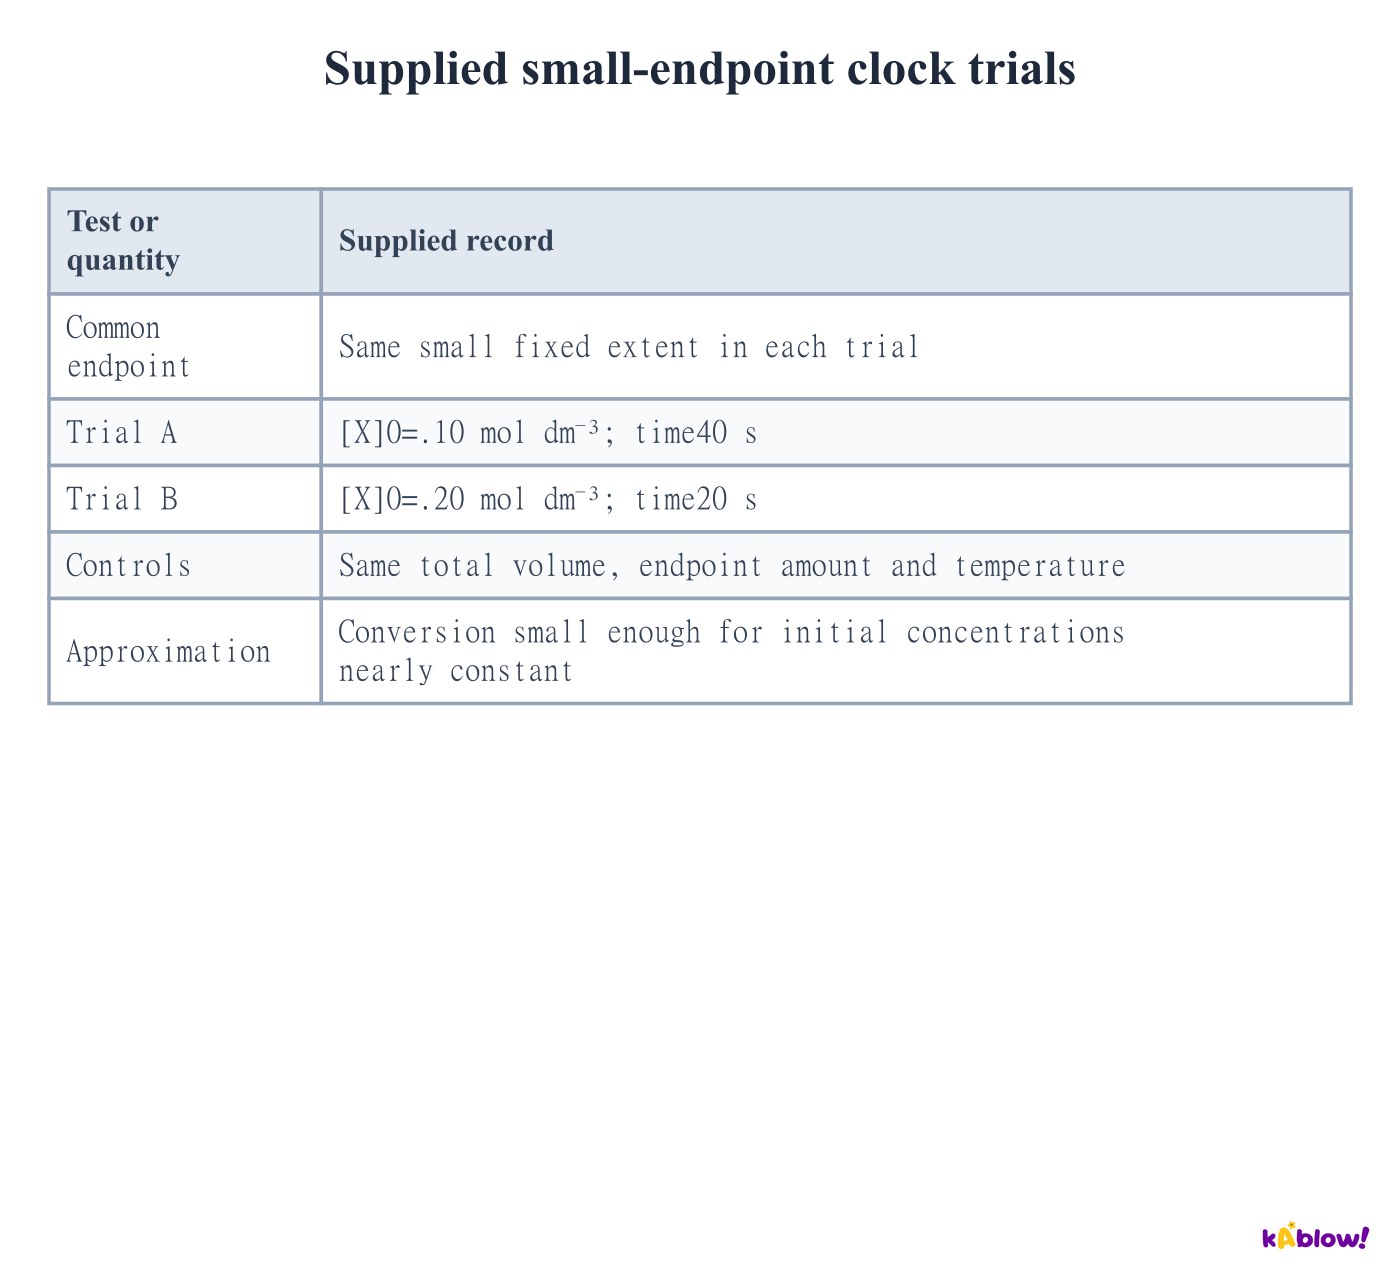
- A clock measures the time to a known small extent. With the same endpoint amount and total volume, rate is approximately proportional to1/t when initial concentrations change little.
- The supplied doubling of X halves time, so its initial-rate proxy doubles. This supports first order in X under the stated approximation and controls.
- 1/t has units s⁻¹ and is a proxy, not automatically a concentration rate. Multiply the known endpoint concentration change by1/t when an absolute rate is required.
Supplied small-endpoint clock trials
Separate repeatability from accuracy
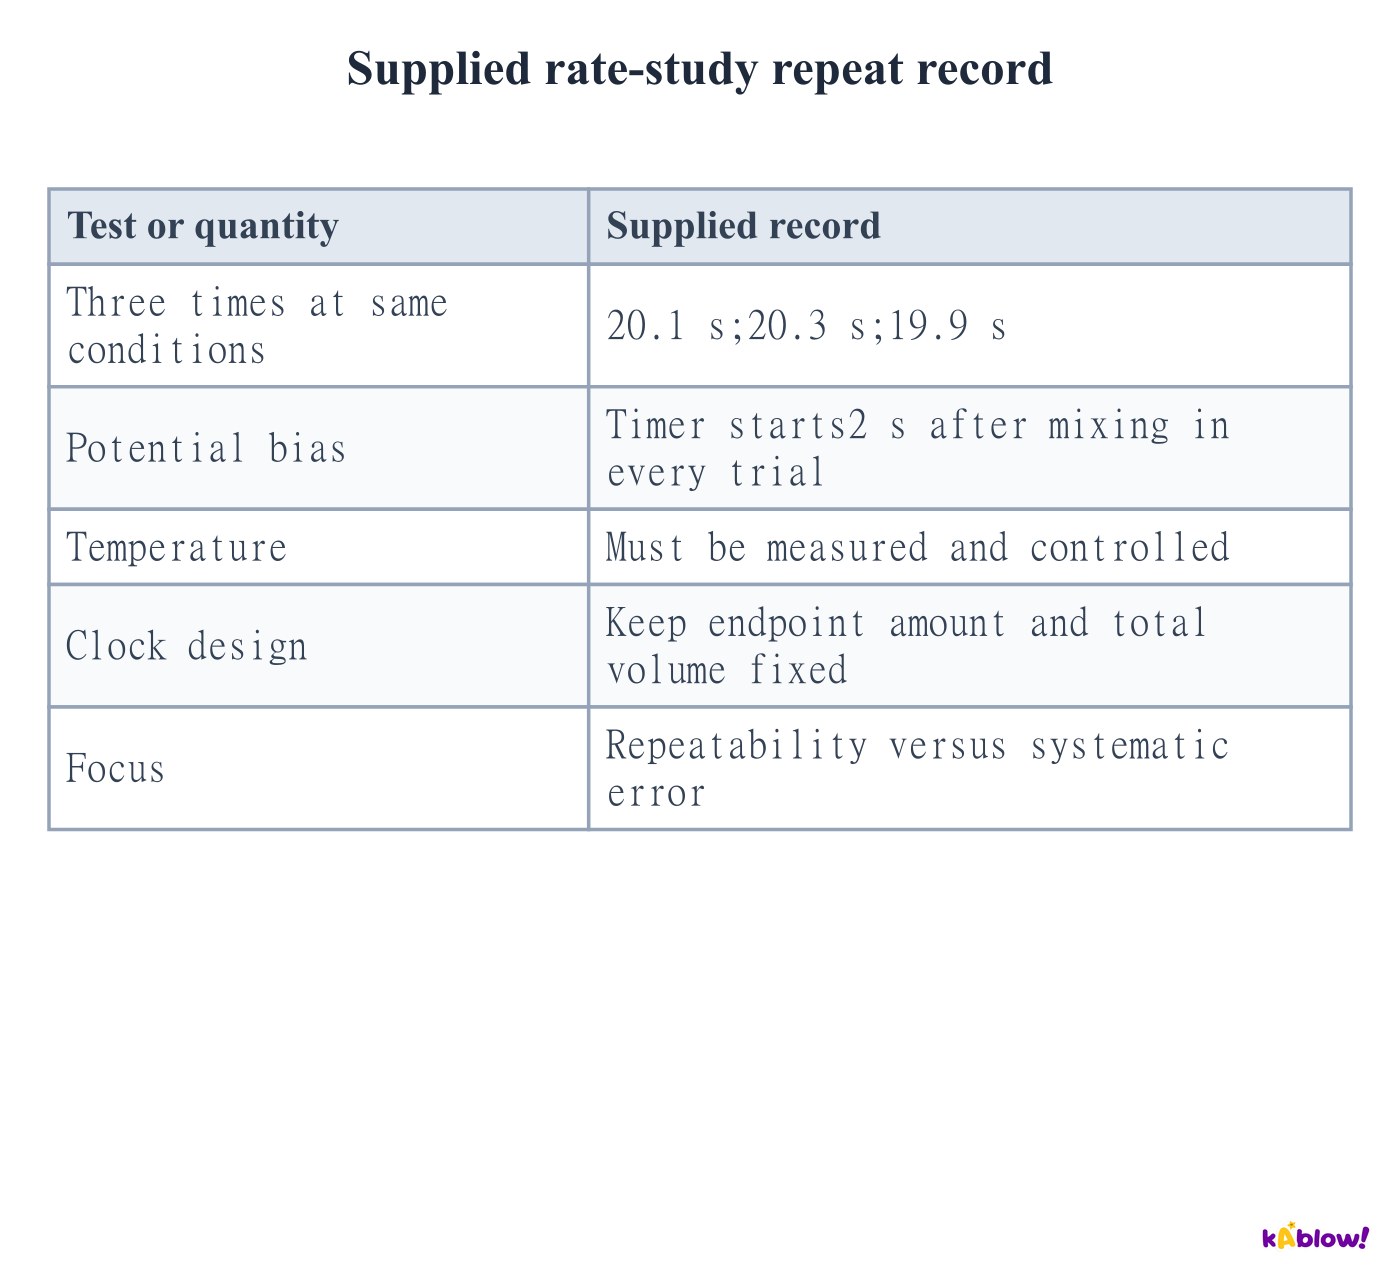
- Closely agreeing repeat times indicate repeatability. A common mixing or timing delay can still bias every result.
- Repeat experiments, identify anomalous trials, calculate a justified mean and report measurement uncertainty. Do not assume a mean removes systematic error.
- Control temperature, mixed volumes and endpoint amount. Use the same timing convention and improve rapid mixing or automatic detection where appropriate.
Supplied rate-study repeat record
Use the Arrhenius equation with consistent units
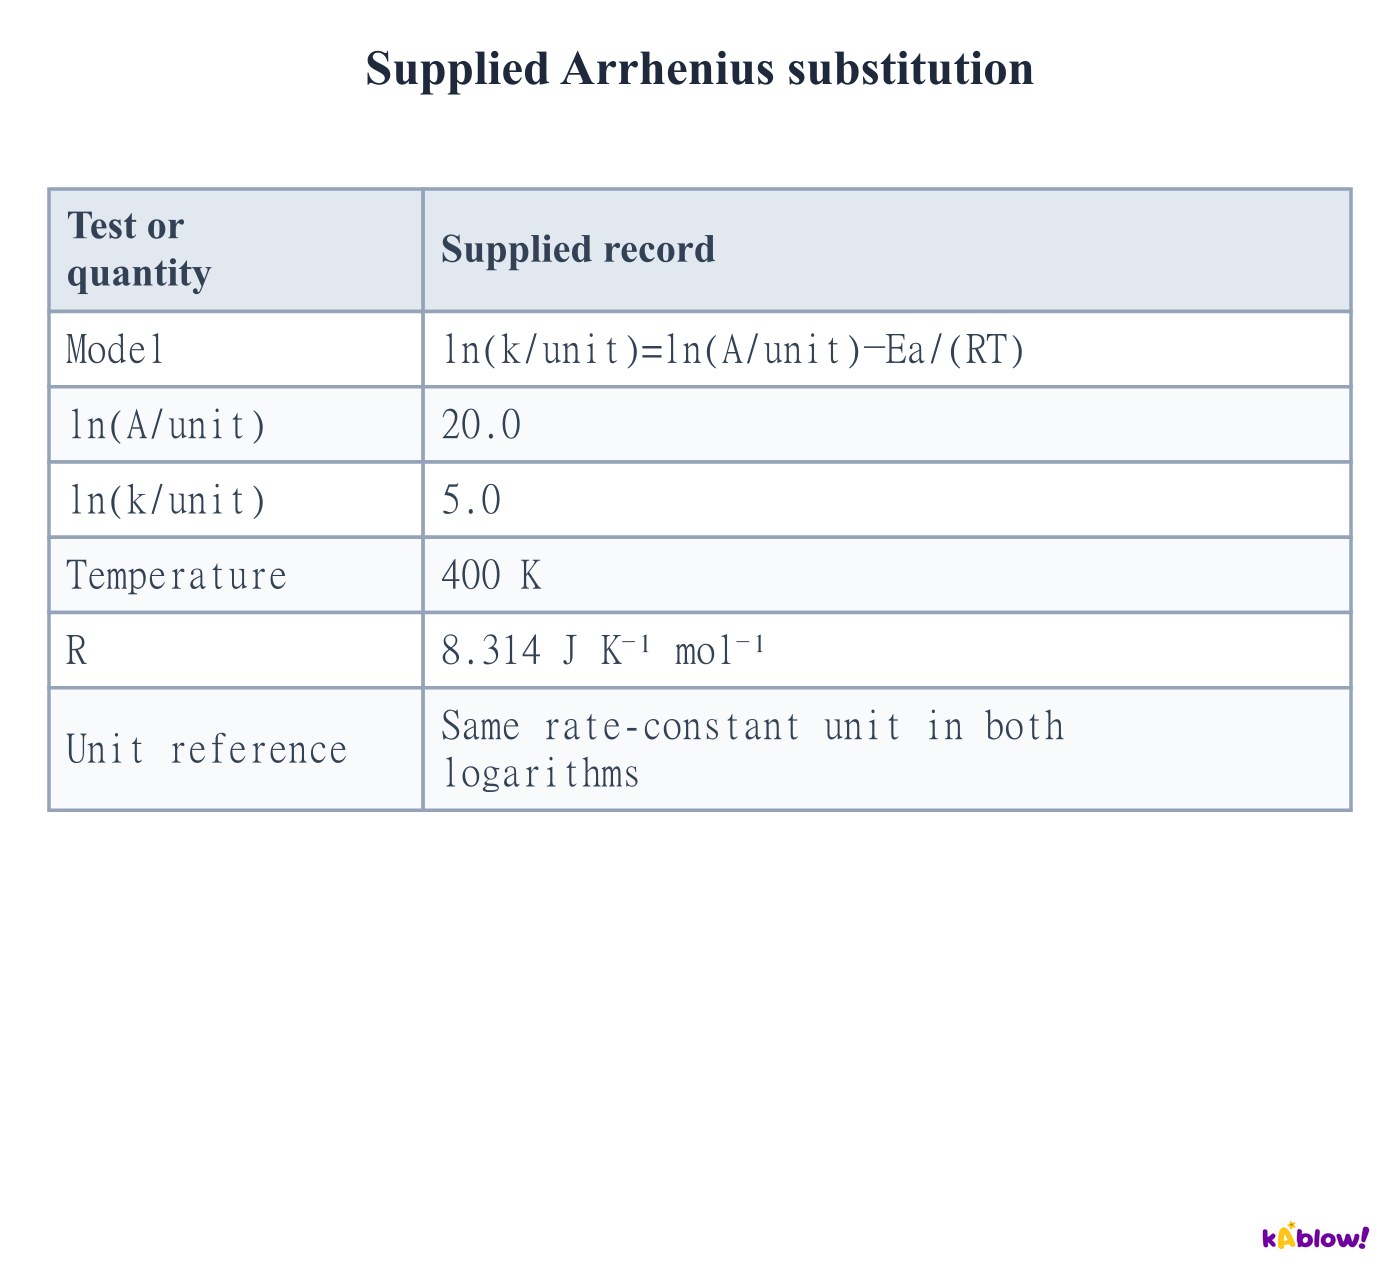
- Use k=A exp(−Ea/RT), or ln(k/unit)=ln(A/unit)−Ea/(RT). A and k have the same units; both logarithms use the same reference unit.
- Use thermodynamic temperature in kelvin. With R=8.314 J K⁻¹ mol⁻¹, Ea must be in J mol⁻¹ before conversion to kJ mol⁻¹.
- The supplied difference20−5=15 gives Ea=15×8.314×400=49884 J mol⁻¹, or49.9 kJ mol⁻¹ to three significant figures. The model assumes A and Ea apply over its investigated range.
Supplied Arrhenius substitution
Extract activation energy from an Arrhenius plot
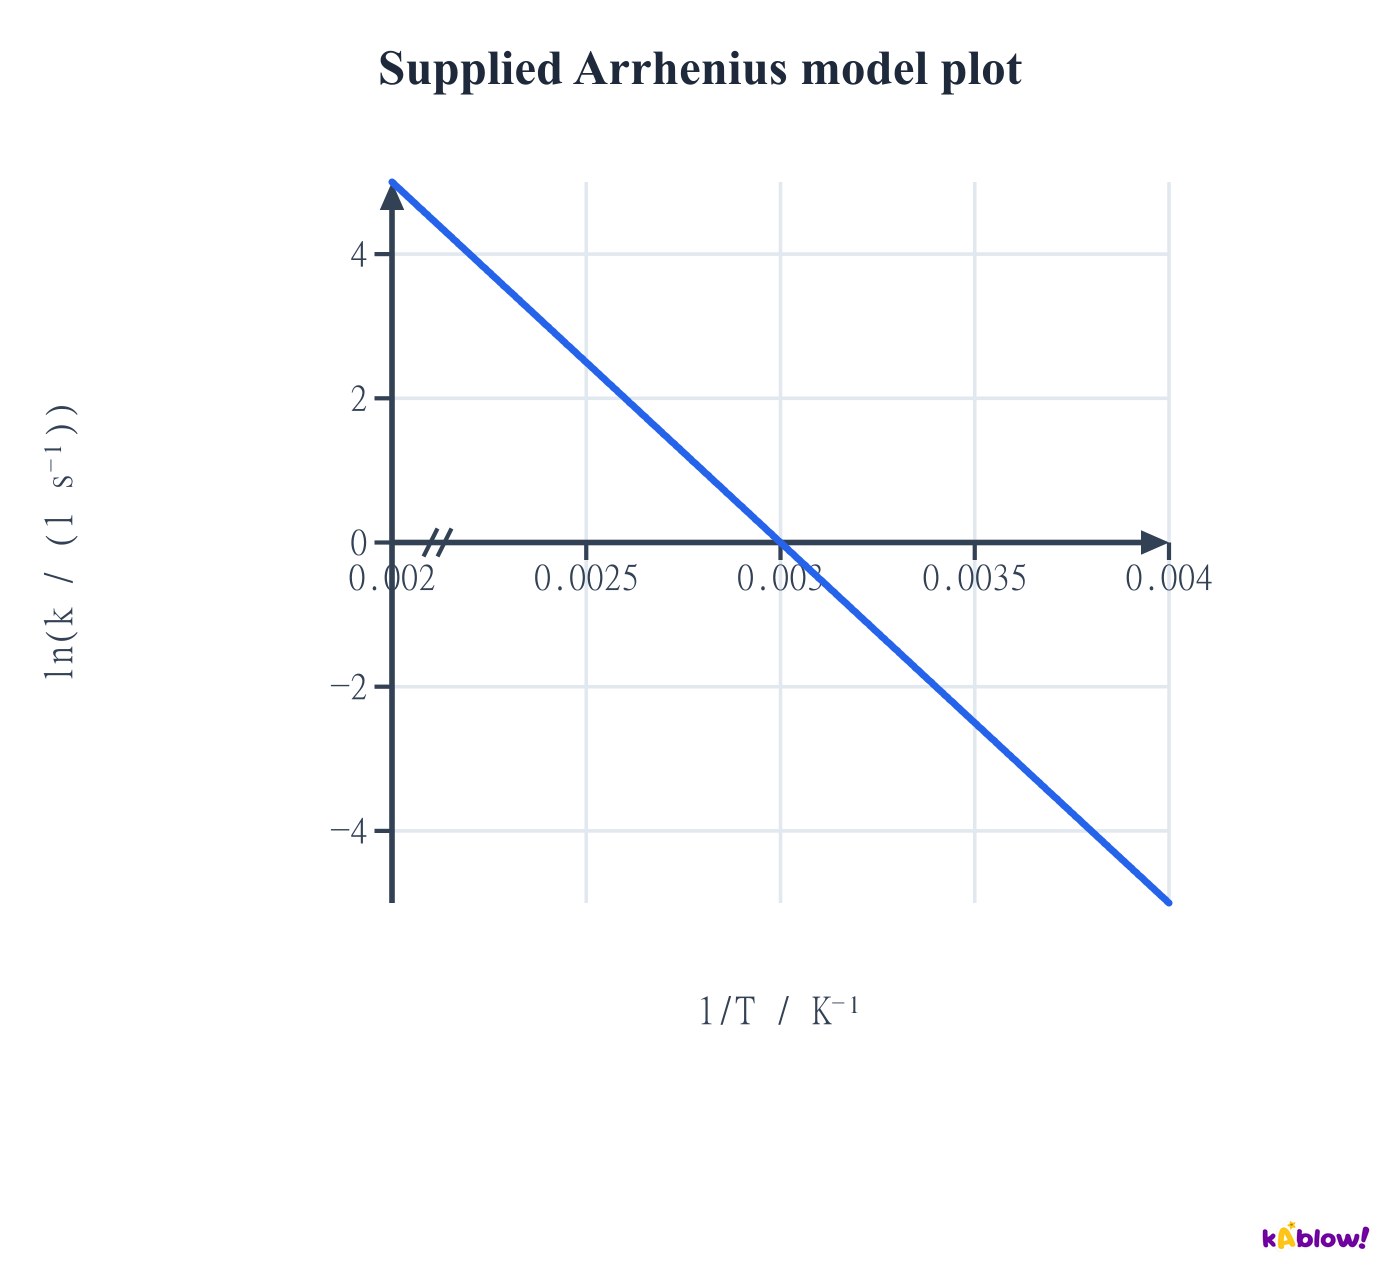
- Plot ln(k/unit) vertically against1/T horizontally. The gradient is−Ea/R, and the extrapolated vertical intercept is ln(A/unit).
- The supplied unscaled reciprocal-temperature line has gradient−5000 K. Ea=5000×8.314=41570 J mol⁻¹=41.57 kJ mol⁻¹.
- For positive Ea, the line falls as1/T rises. Higher temperature lies to the left. Do not interpret an extrapolated intercept as a measured infinite-temperature result.
Supplied Arrhenius model plot
Compare rate constants at two temperatures
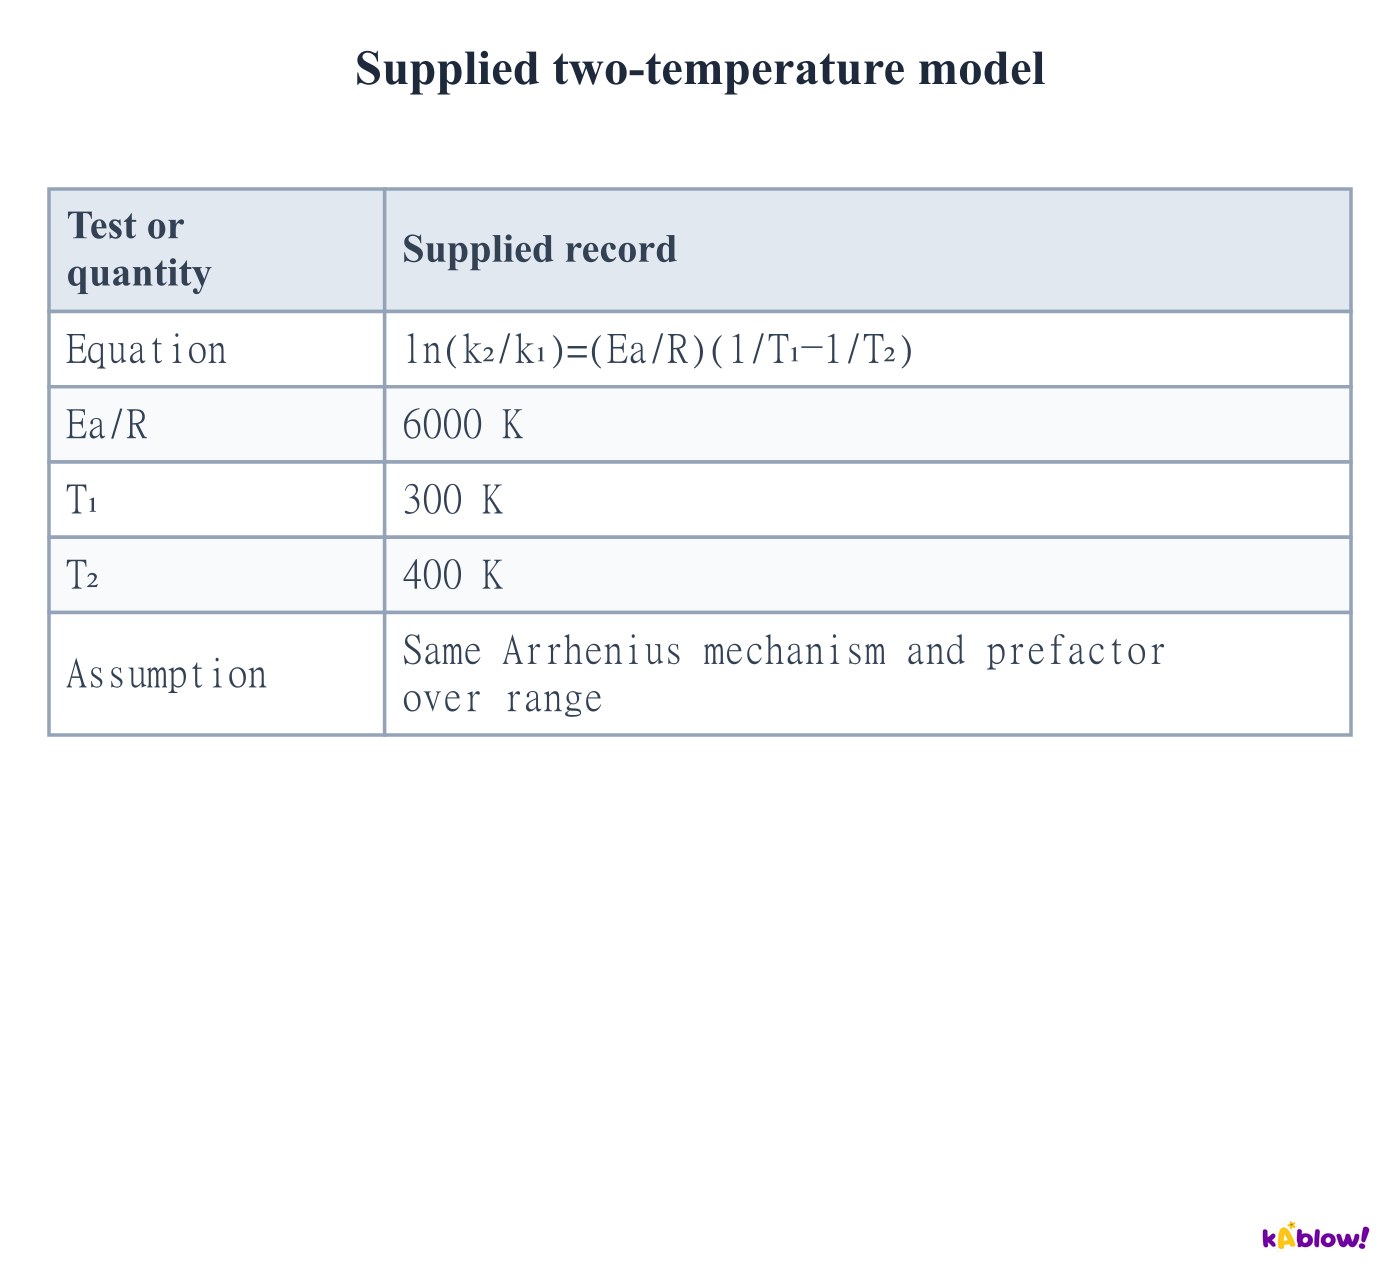
- Subtract the two Arrhenius equations to eliminate a common prefactor: ln(k₂/k₁)=(Ea/R)(1/T₁−1/T₂).
- For the supplied300 K and400 K data, the logarithmic ratio is6000×(1/300−1/400)=5. Thus k₂/k₁=e⁵, approximately148.
- This comparison assumes the same mechanism and effective Arrhenius parameters over the range. A higher k need not guarantee the same measured rate if concentrations or other conditions also change.
Supplied two-temperature model
Check reciprocal-temperature axis scaling
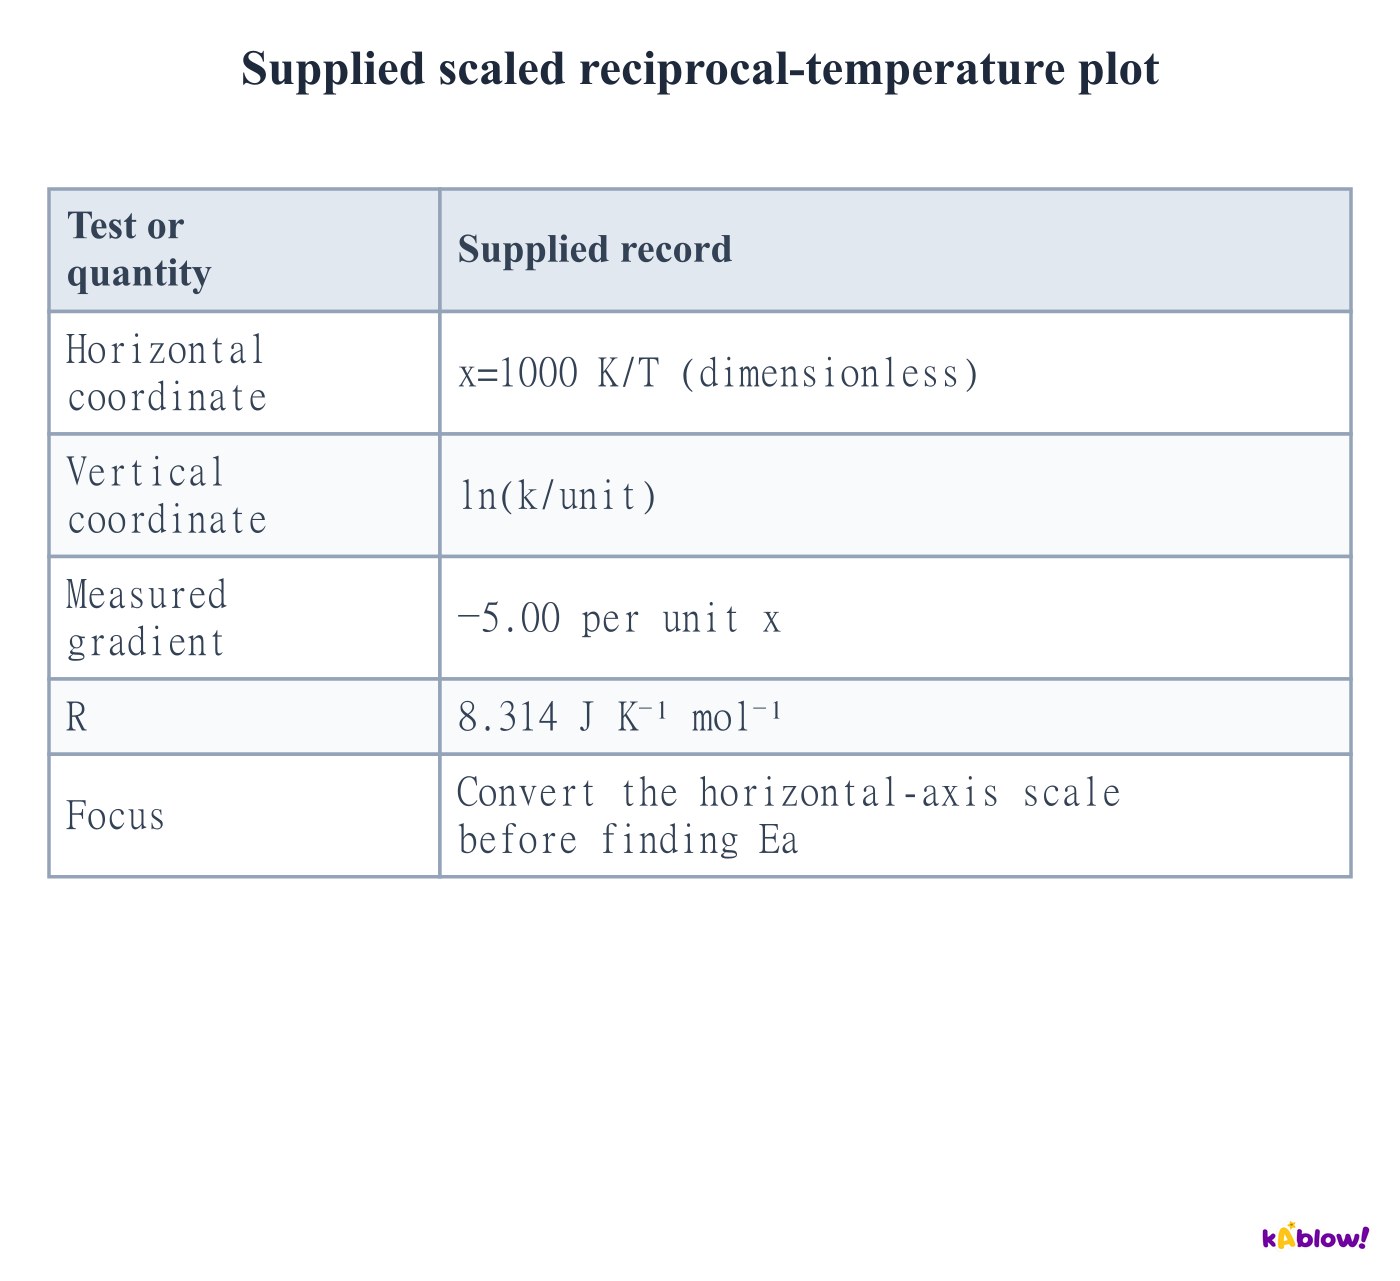
- If x=1000 K/T, then1/T=x/(1000 K). The Arrhenius gradient against x is−Ea/(1000 K×R).
- A supplied gradient−5.00 therefore gives Ea=5.00×1000×8.314=41570 J mol⁻¹, not41.57 J mol⁻¹.
- Read axis factors and units before substitution. A graph of log10(k/unit) would require an additional ln10 factor; the standard AQA form uses natural logarithms.
Supplied scaled reciprocal-temperature plot
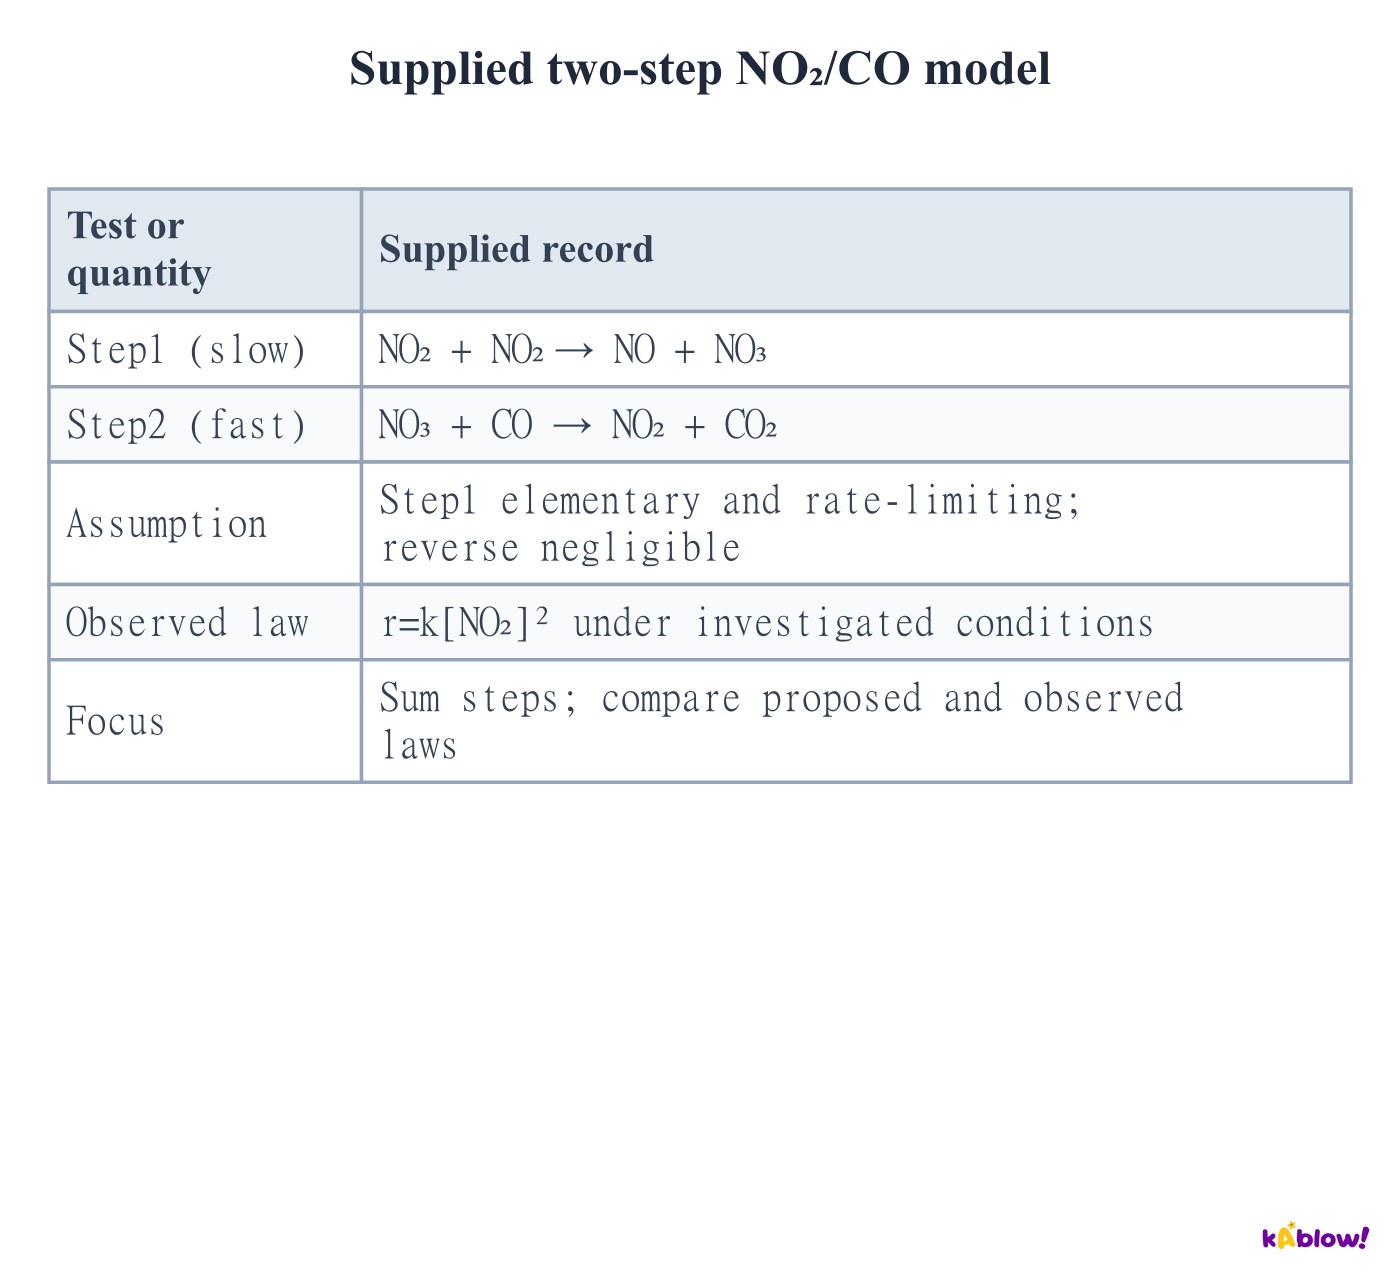
Test an elementary slow-step proposal
- Add the supplied NO₂/CO steps and cancel species appearing on both sides. The overall equation is NO₂+CO→NO+CO₂; NO₃ is formed then consumed.
- Under the stated elementary slow-first-step approximation, the predicted rate is k[NO₂]², consistent with the supplied observed law.
- Consistency supports a possible mechanism but does not prove it uniquely. Overall coefficients alone would not justify the empirical second order in NO₂.
Supplied two-step NO₂/CO model
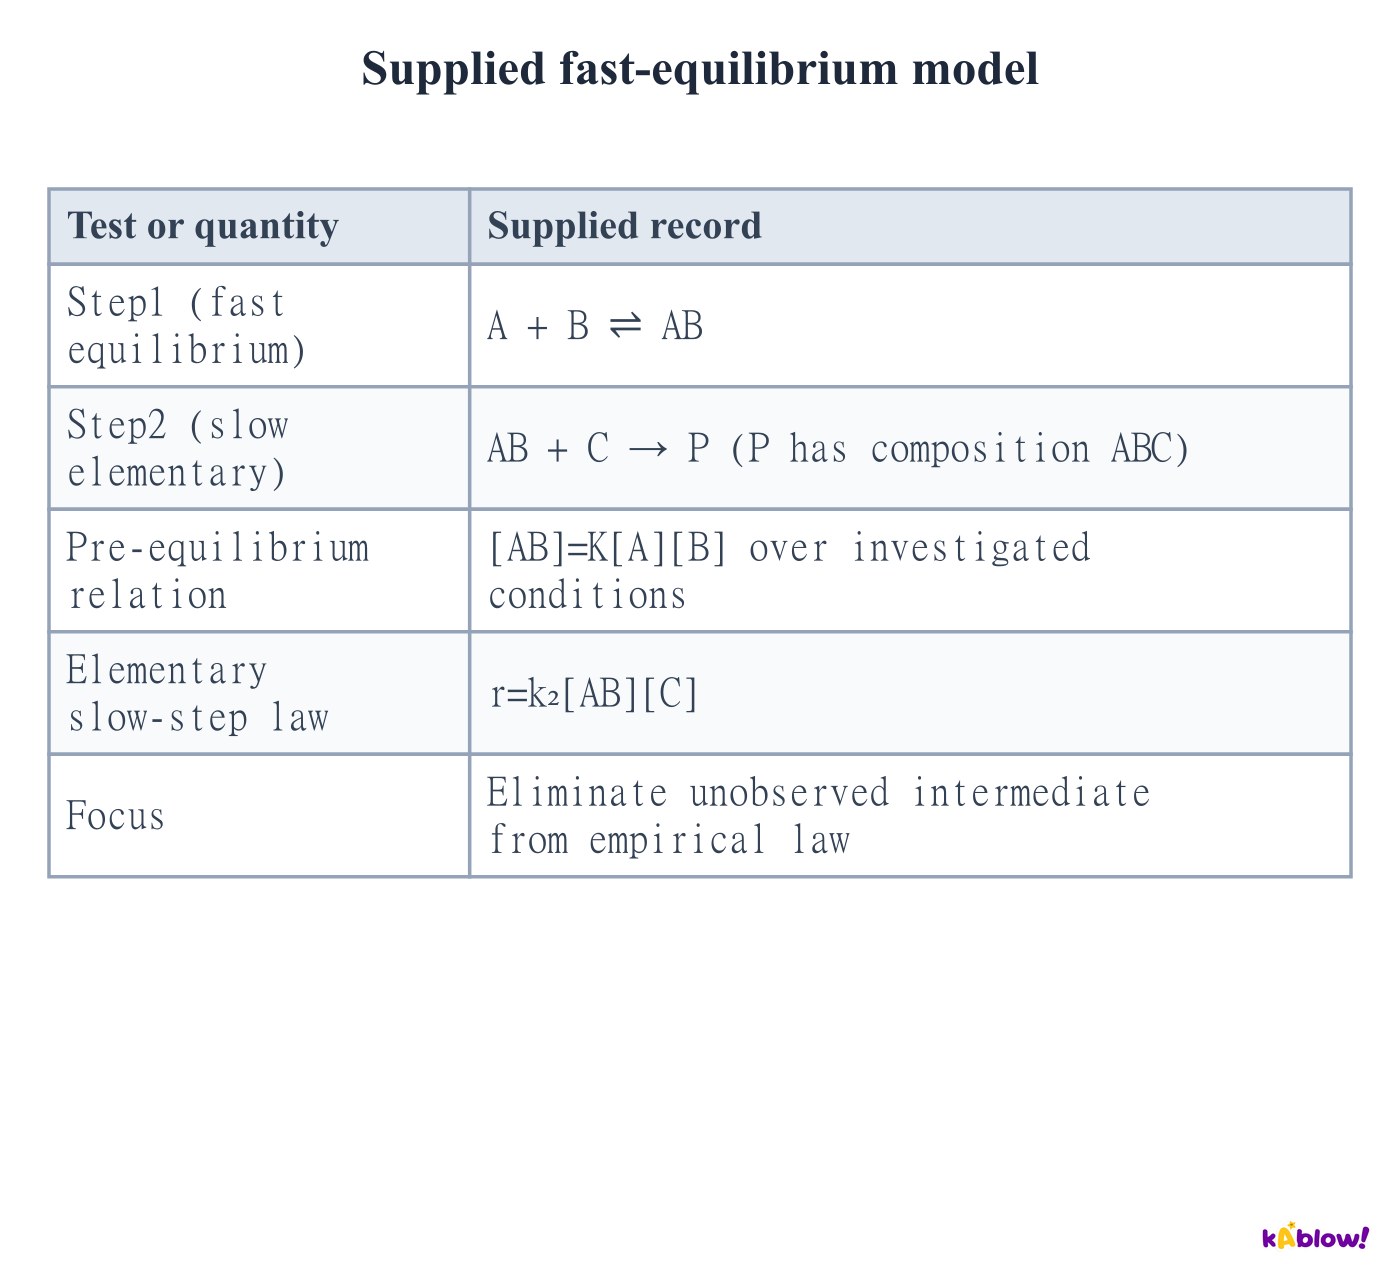
Include a prior fast equilibrium when needed
- The slow elementary step gives r=k₂[AB][C]. The prior equilibrium gives[AB]=K[A][B]. Substitute to obtain r=k₂K[A][B][C].
- Thus A and B can appear in the observed rate law even though the slow step directly consumes AB rather than separate A and B.
- The pre-equilibrium relation requires the stated fast reversible conditions. A fast irreversible formation step alone would not justify it.
Supplied fast-equilibrium model
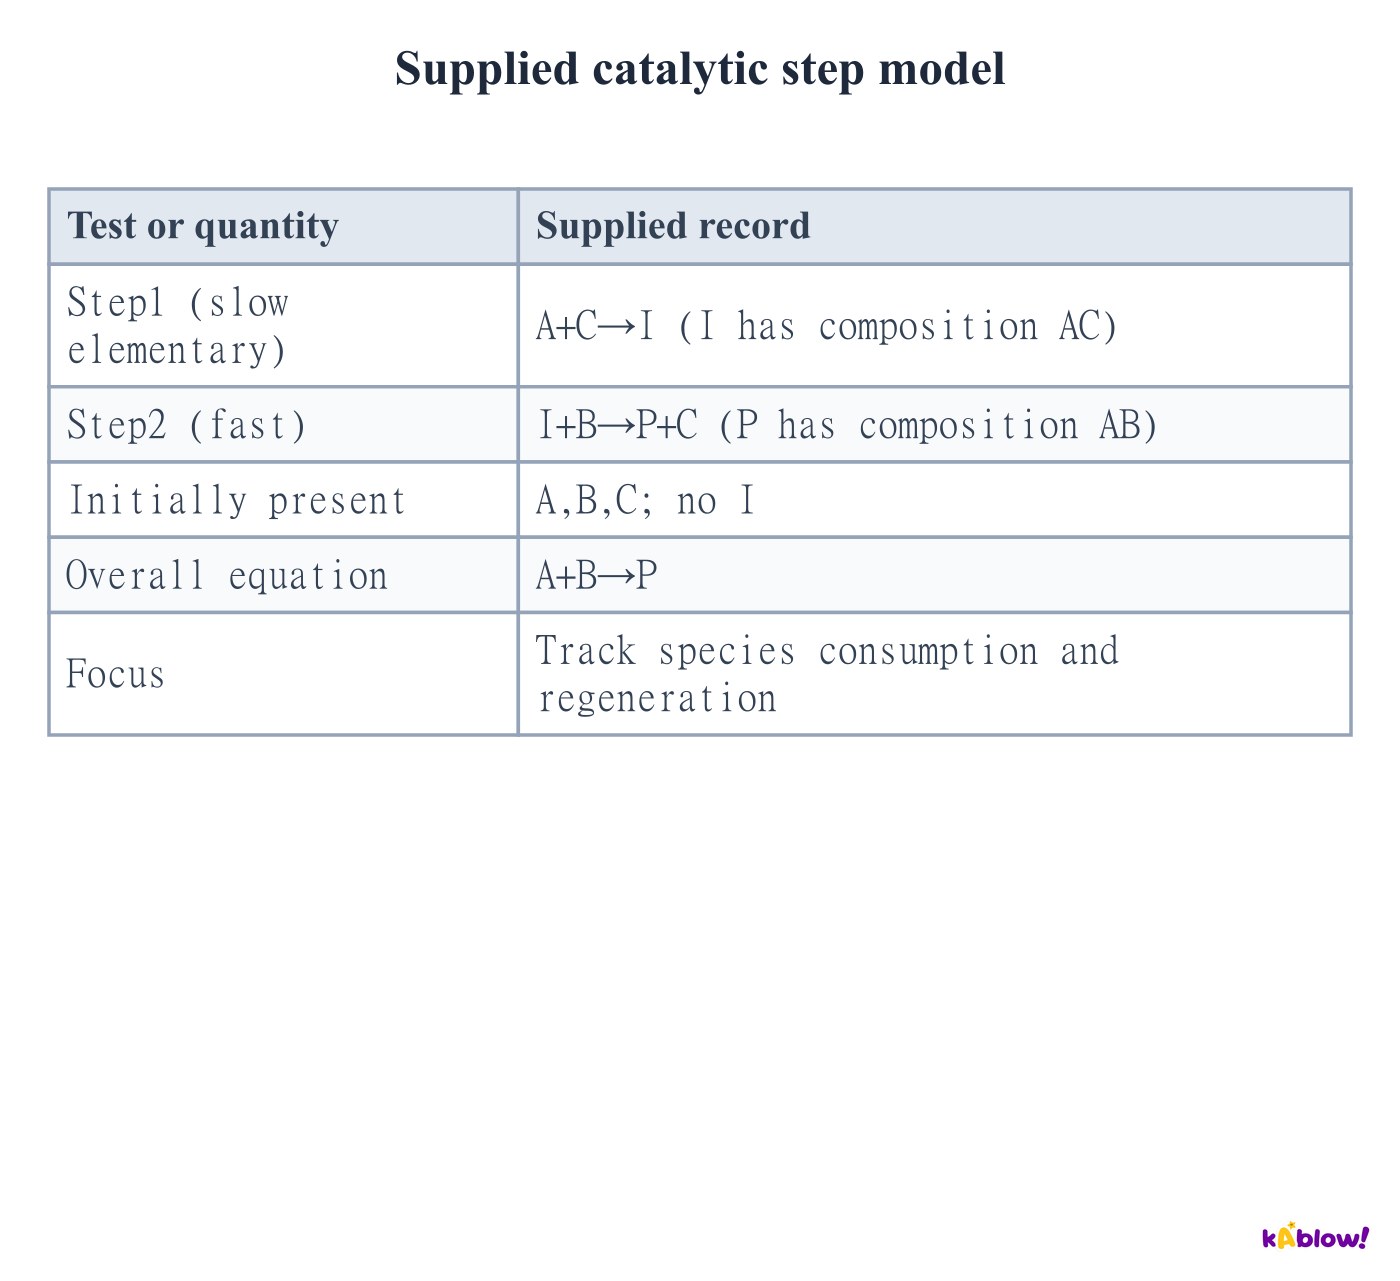
Distinguish catalyst from intermediate
- In the supplied model C is initially present, consumed in step1 and regenerated in step2. It cancels from the overall reaction and acts as the catalyst.
- I is initially absent, forms in step1 and is consumed in step2. It is an intermediate. The stated AC and AB compositions preserve the labelled atom groups.
- A species appearing in an empirical rate law but absent overall is not automatically a catalyst. Use the full consumption/regeneration evidence; intermediates can form before or during a slow step.
Supplied catalytic step model
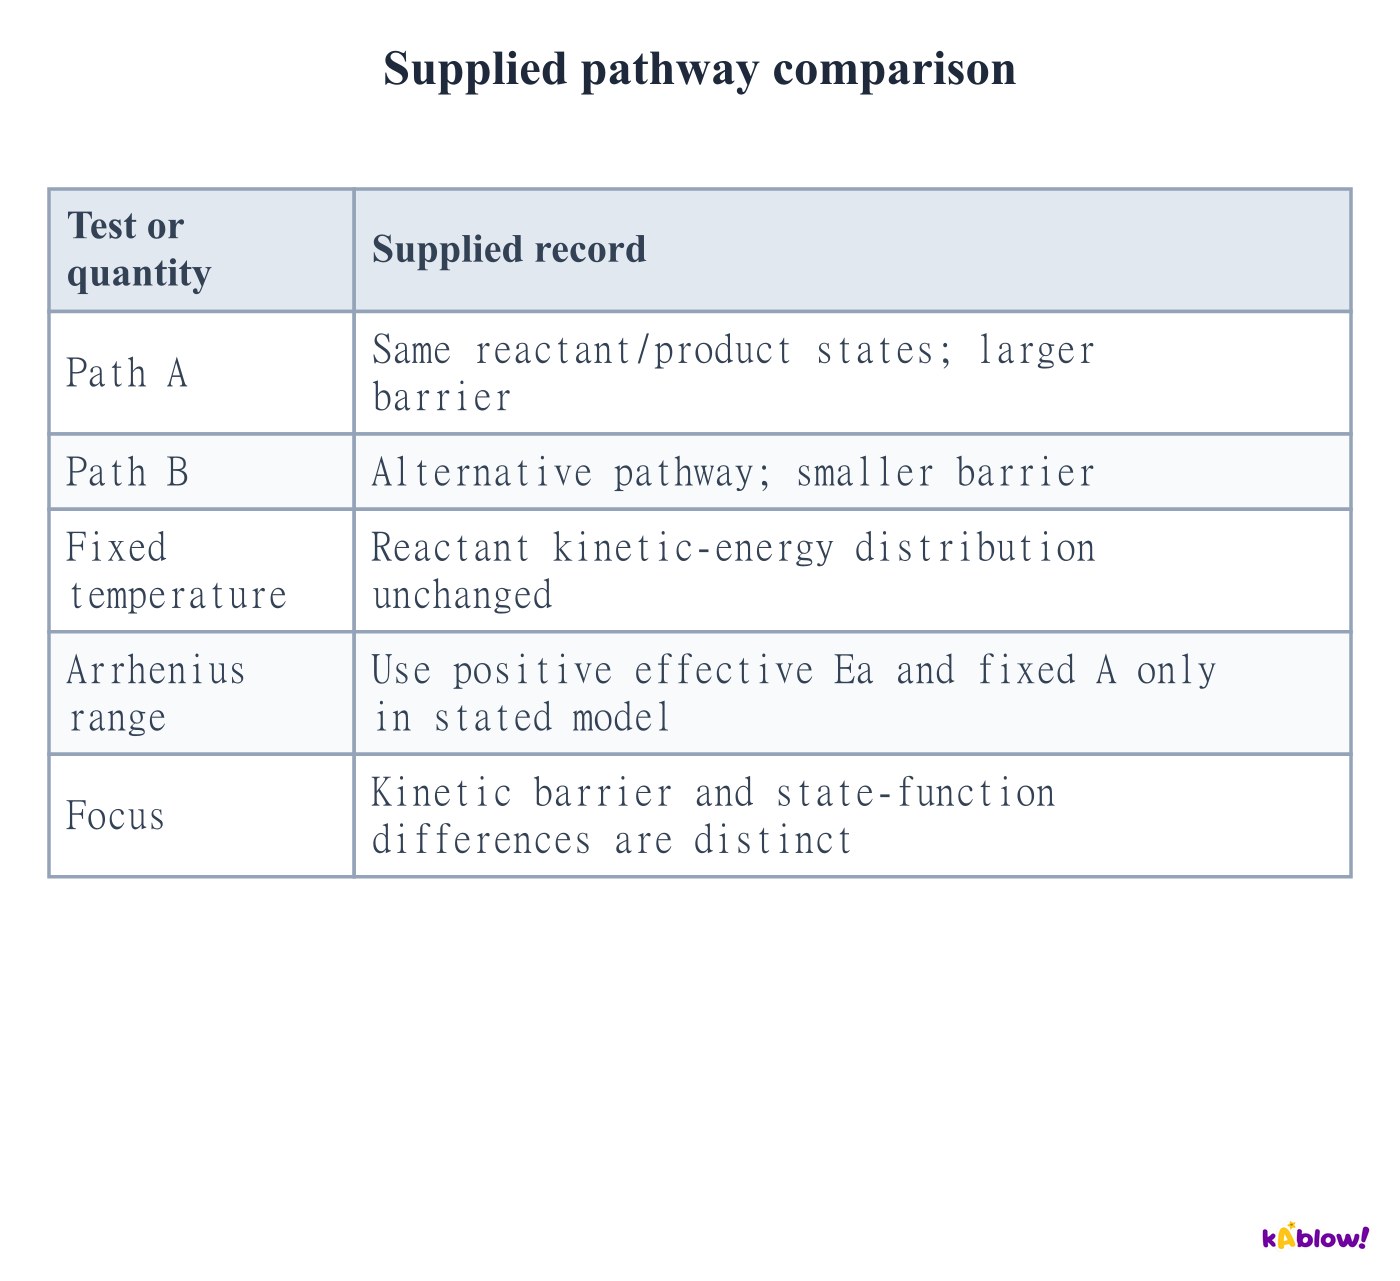
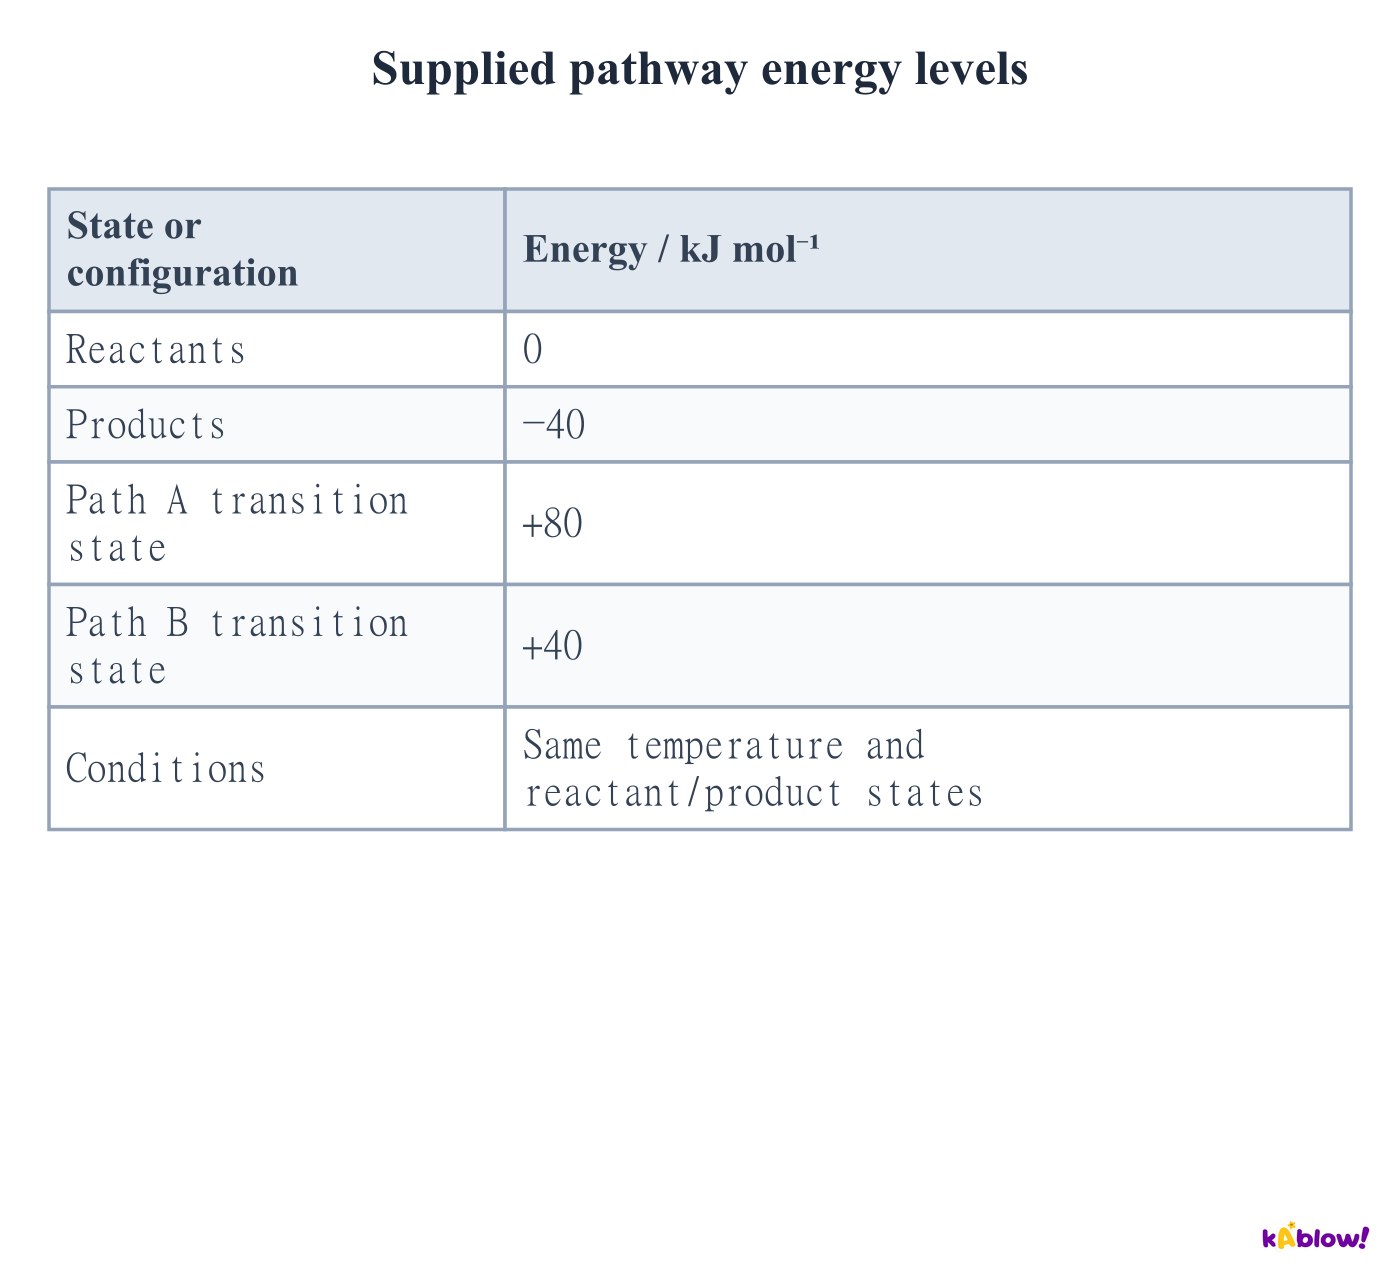
Separate activation barriers from thermodynamics
- Activation energy describes the kinetic barrier associated with a pathway. It does not define electrophilic substitution or the reactant–product enthalpy difference.
- A catalyst supplies an alternative route and can change effective kinetic parameters. At the same temperature it does not shift the reactant energy distribution or change the equilibrium constant.
- An intermediate is a species formed and consumed between steps. A transition state lies at a barrier maximum and is not a stable, isolatable intermediate. Rate-law and temperature evidence constrain mechanisms without identifying a unique one.
Supplied pathway comparison
Slide
Sign up free to view the lesson slides
Step through every slide for this topic — plus flashcards and revision notes — with a free account.
Câu hỏi luyện tập
Xem trước miễn phí — 8 trên 60 câu hỏi. Đăng ký để xem tất cả.
1.Using the supplied record, what is the mean positive disappearance rate of A?
Medium- A0.0010 mol dm⁻³ s⁻¹
- B0.0020 mol dm⁻³ s⁻¹
- C−0.0020 mol dm⁻³ s⁻¹
- D0.020 mol dm⁻³ s⁻¹
2.For the supplied empirical model, what is the overall order?
Medium- AOne
- BTwo
- CThree
- DFour
3.Which order in A is consistent with supplied rate–concentration plot A?
Medium- AZero
- BFirst
- CSecond
- DThird
4.What happens to rate when concentration doubles on supplied rate–concentration plot B?
Medium- AIt is unchanged
- BIt doubles
- CIt quadruples
- DIt halves
5.By what factor does rate change from[A]=0.25 to0.50 mol dm⁻³ on supplied plot C?
Medium- A2
- B4
- C8
- D0.5
6.Which rate equation fits all three supplied experiments?
Medium- Ar=k[A][B]
- Br=k[A]²[B]
- Cr=k[A][B]²
- Dr=k[A]²
7.What can the supplied pair establish under its stated model?
Medium- Am=2 and n=0 uniquely
- Bm=1 and n=1 uniquely
- Cm+n=2, with individual orders undetermined
- DBoth orders must be zero
8.Calculate k from the supplied numerical record.
Medium- A0.20 dm⁶ mol⁻² s⁻¹
- B2.0 dm⁶ mol⁻² s⁻¹
- C20 dm⁶ mol⁻² s⁻¹
- D2.0 s⁻¹
Unlock all 60 questions, flashcards & more
Tạo tài khoản miễn phí để xem mọi câu hỏi, slide, thẻ ghi nhớ và ghi chú ôn tập cho chủ đề này.