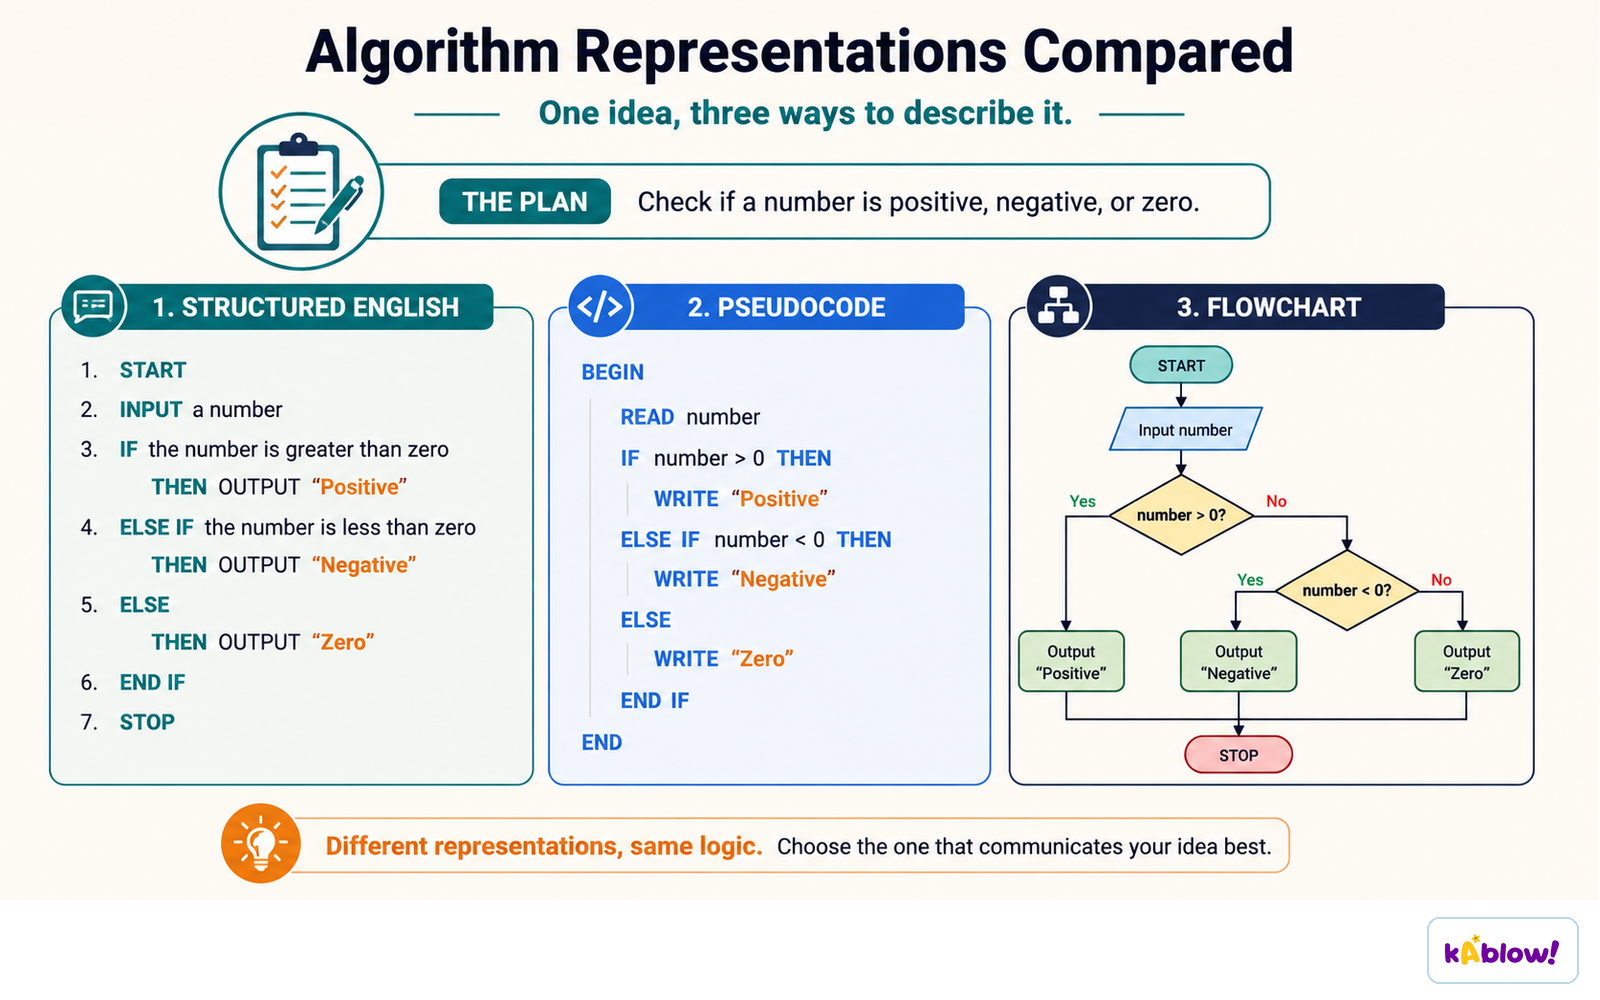
A flowchart is a diagram of an algorithm. Standard symbols: terminator (rounded box, start/end), process (rectangle), decision (diamond, with yes/no or true/false branches), input/output (parallelogram) and arrows showing flow.
Rules: one start, at least one end, one arrow in and out of each process; decisions have two exits.
Read, test and report
Pseudocode
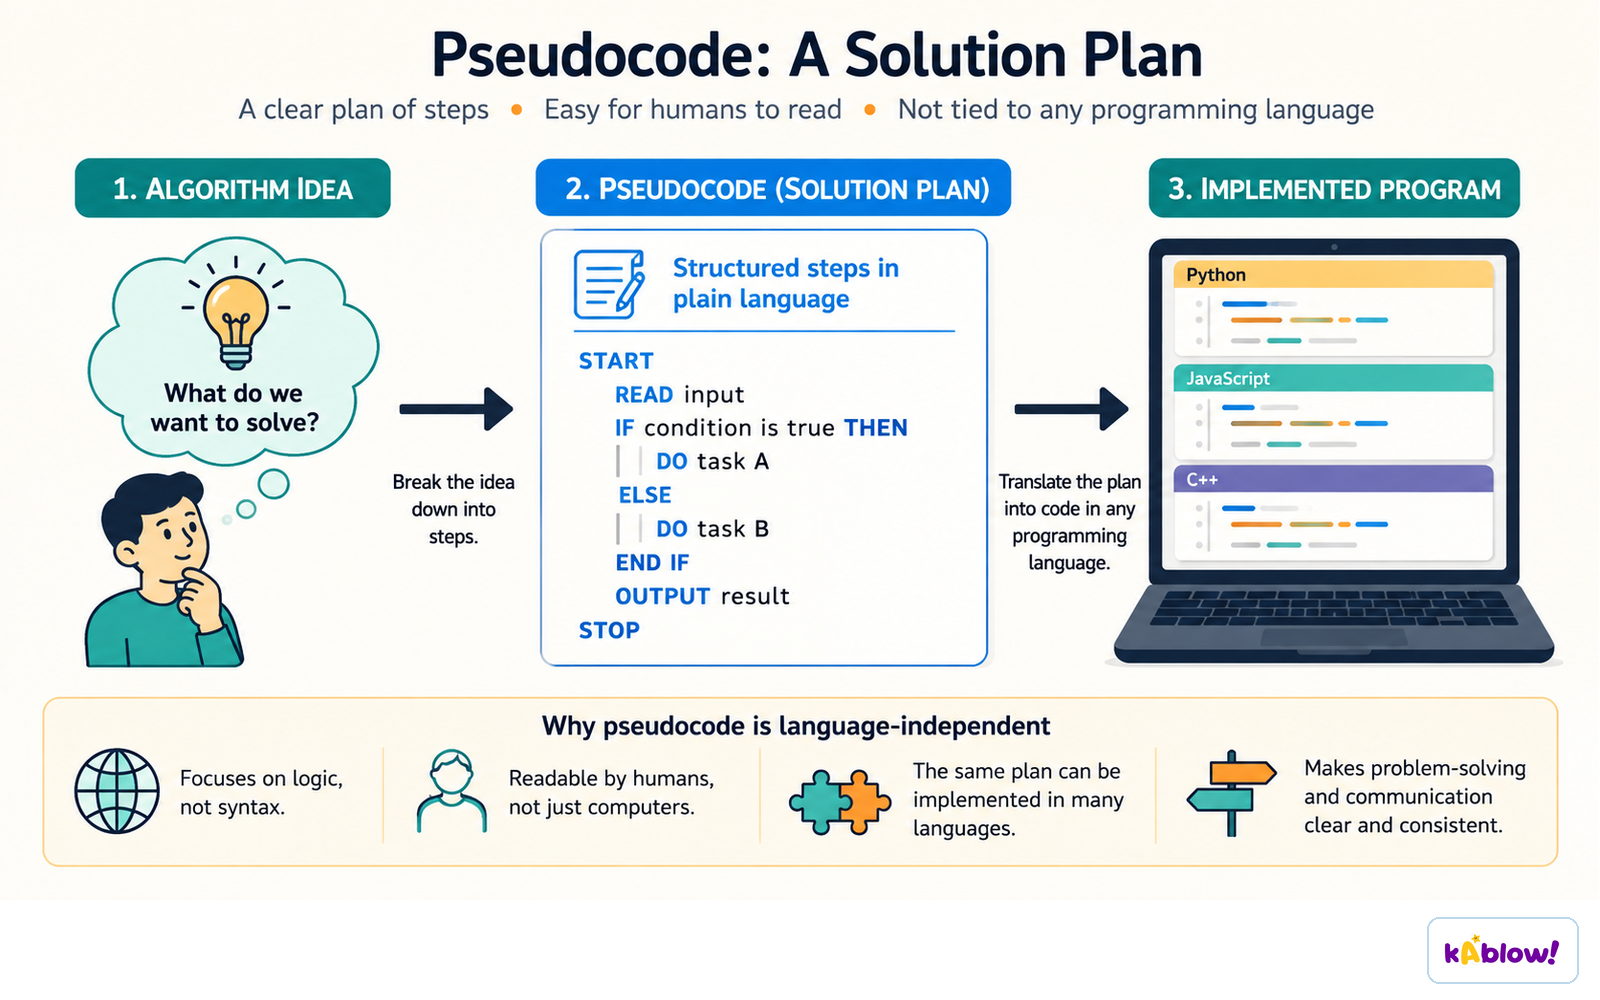
Pseudocode is a structured, language-independent way to write algorithms. It is not a real language but uses programming-like keywords such as INPUT, OUTPUT, IF ... THEN ... ELSE ... ENDIF, WHILE ... ENDWHILE, FOR ... NEXT.
Example: age = INPUT; IF age ≥ 18 THEN OUTPUT "Adult" ELSE OUTPUT "Minor" ENDIF.
Planning with pseudocode
Converting between forms
Translate the algorithm’s meaning, not just its appearance: decision nodes can express IF branches or loop conditions.
A loop-back edge indicates repetition. Preserve initialisation, the condition, updates and both possible exits when changing representation.
Algorithm representations
Trace tables
A trace table records the values of variables as an algorithm runs, showing the output and helping to find logic errors.
Why use them?
They help plan before coding, communicate with others and test logic.
投影片
Sign up free to view the lesson slides
Step through every slide for this topic — plus flashcards and revision notes — with a free account.