
Thermodynamics
खेलकर सीखें
इन सवालों के जवाब देकर एनर्जी कमाएं, फिर मछली पकड़ें और घूमें। कोई अकाउंट नहीं चाहिए।
लेसन नोट्स
Specify standard states and reaction basis
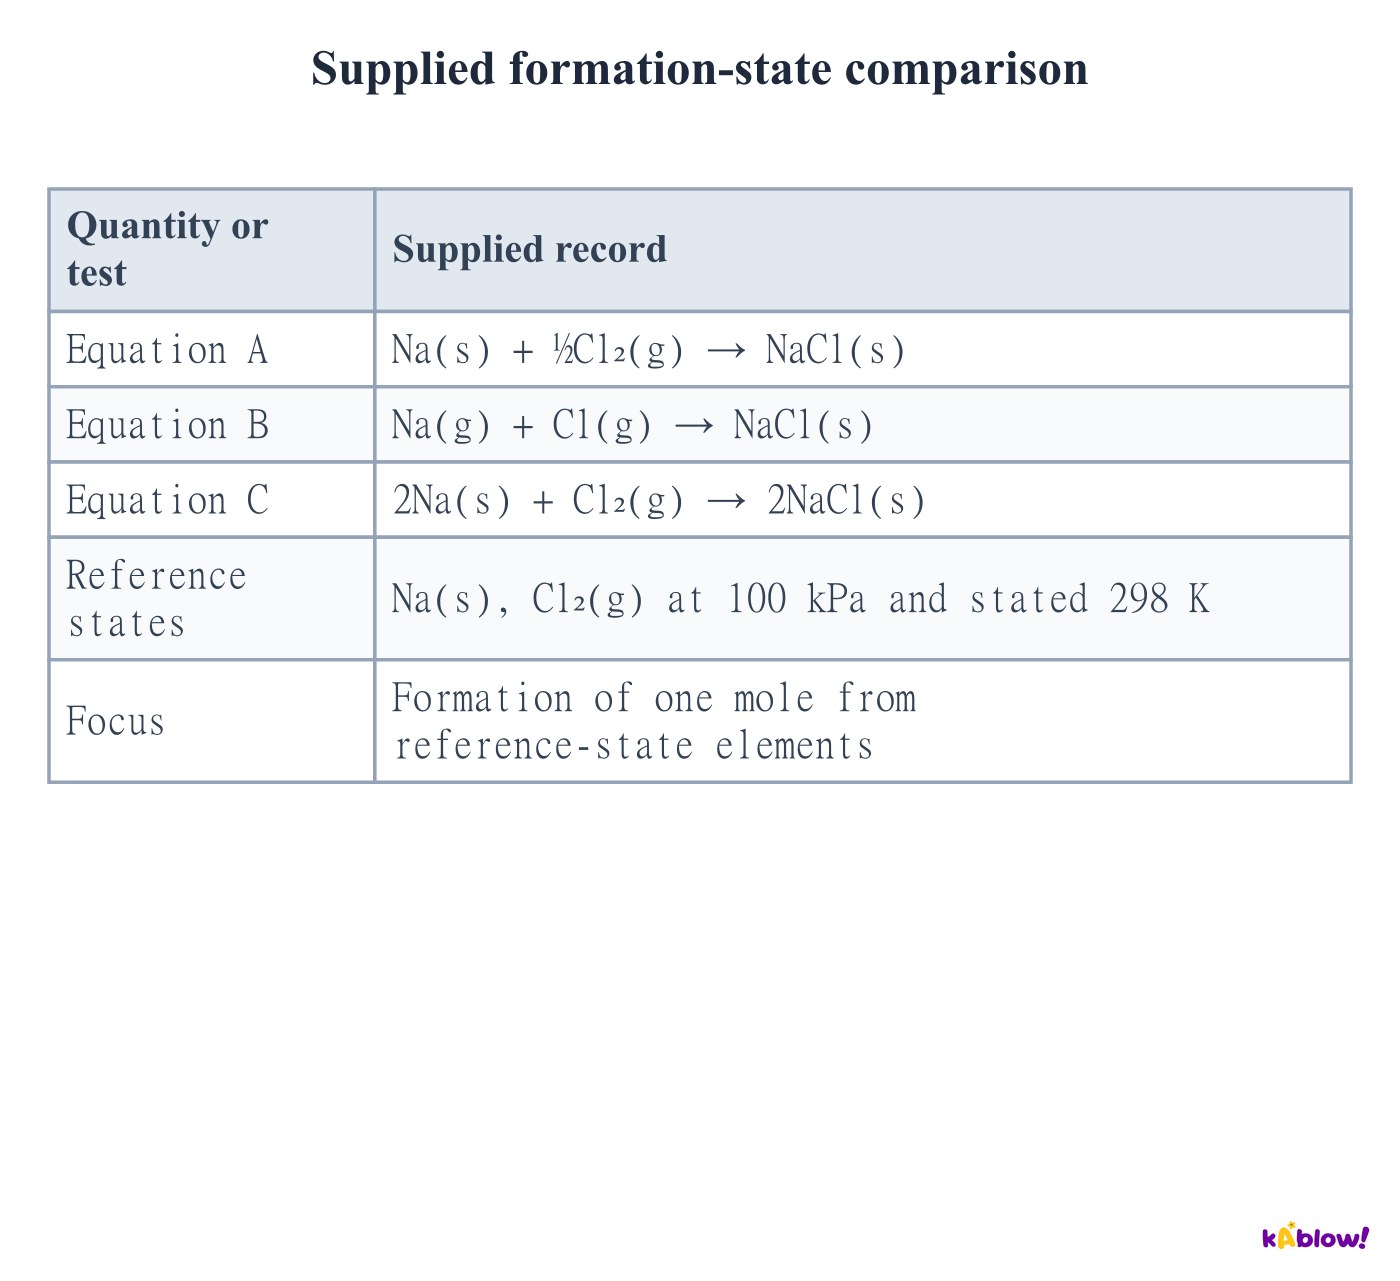
- A standard enthalpy change refers to100 kPa and a stated temperature, commonly298 K. Always specify the chemical equation, physical states and amount basis.
- Standard formation refers to one mole of substance formed from reference-state elements. Reference-state elements have zero standard formation enthalpy by convention; their absolute entropies need not be zero.
- Changing an equation coefficient changes the enthalpy for that written reaction. Gaseous atoms are not the reference-state starting materials for forming sodium chloride from its elements.
Supplied formation-state comparison
Define atomisation using one mole of gaseous atoms
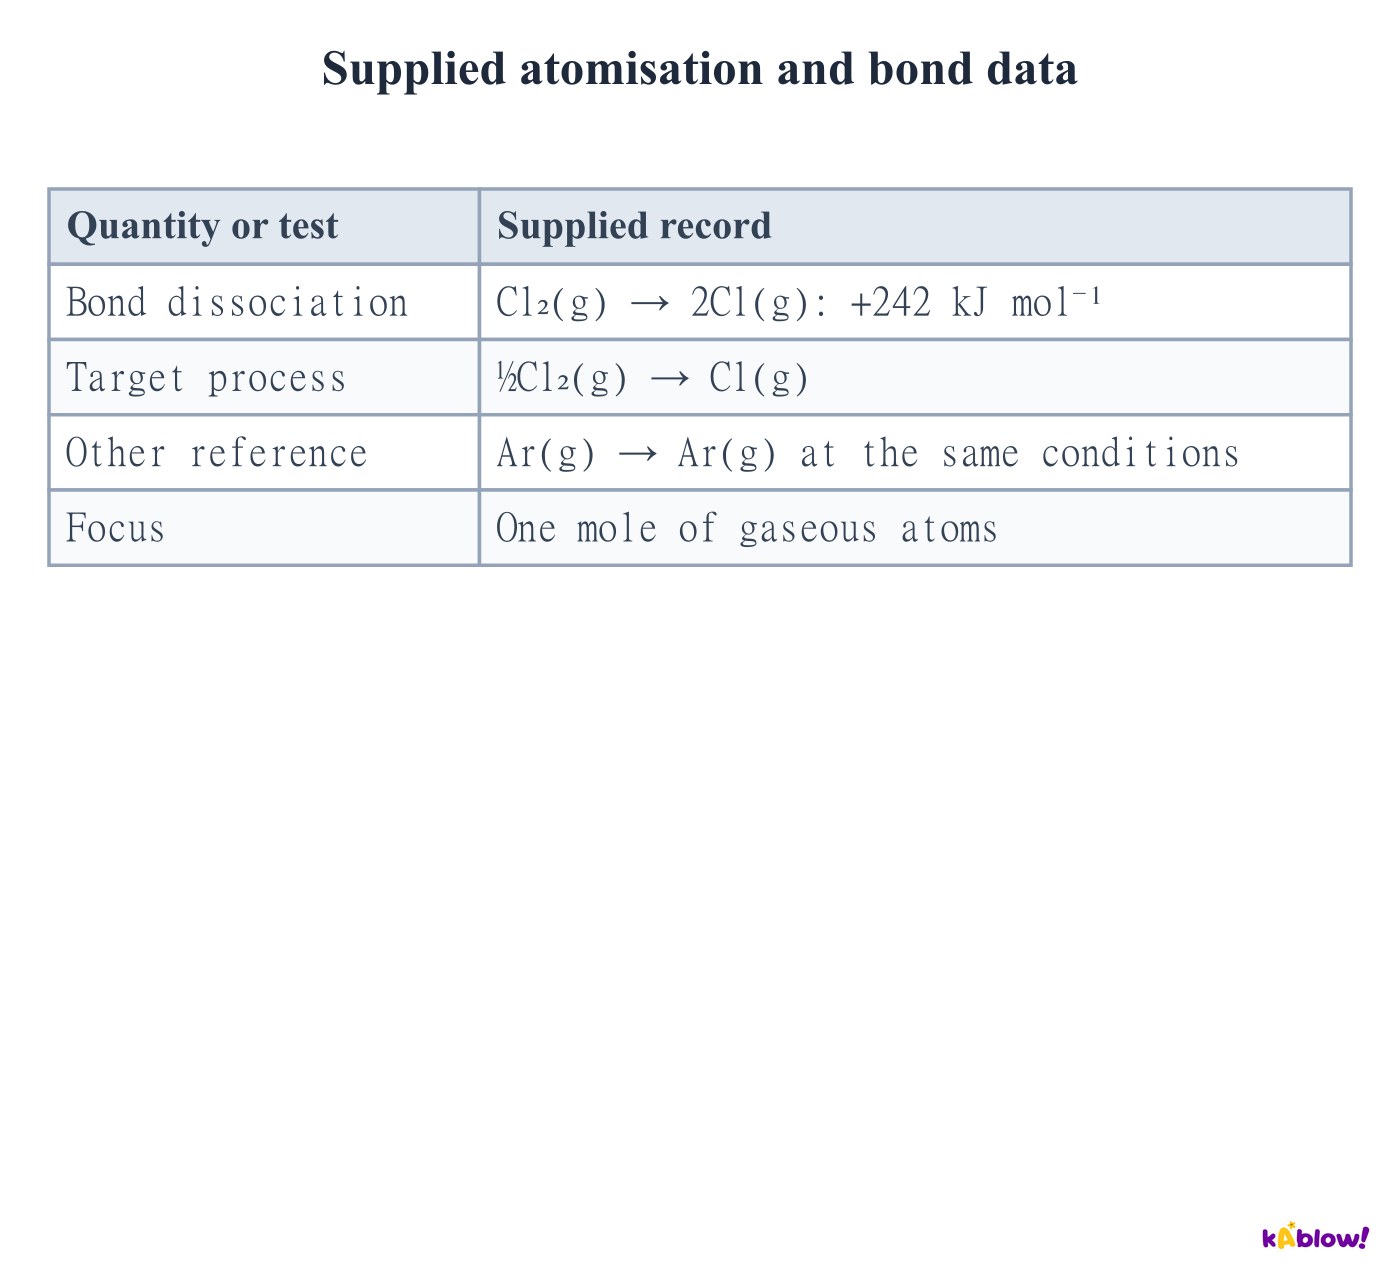
- Atomisation forms one mole of gaseous atoms from the element in its specified reference state. Its equation can require a fractional molecular coefficient.
- For chlorine,½Cl₂(g)→Cl(g) is half of Cl₂(g)→2Cl(g), so the supplied bond-dissociation enthalpy 242 gives atomisation 121 kJ mol⁻¹.
- Atomising ordinary bonded elements requires energy, but an already monatomic reference gas such as Ar(g) has no change for Ar(g)→Ar(g). Do not call every possible atomisation value strictly positive.
Supplied atomisation and bond data
Include successive ionisation energies
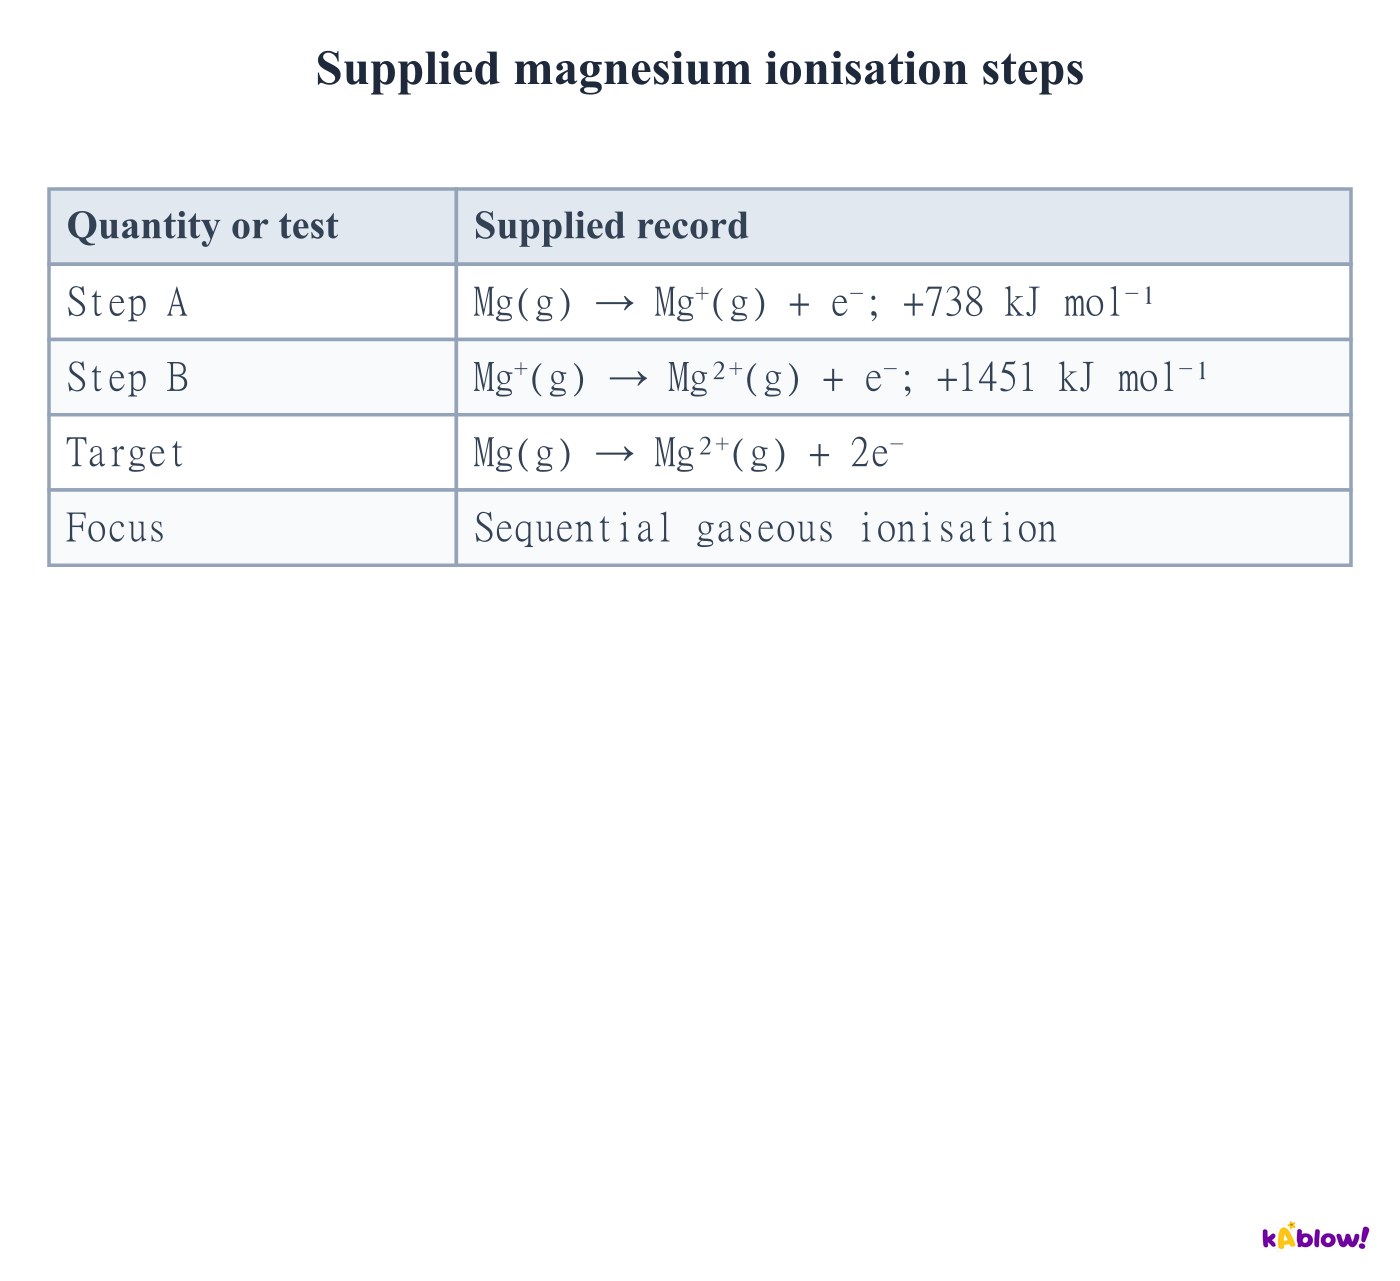
- Ionisation removes an electron from a gaseous atom or ion. The first step starts with atoms; the second starts with singly positive gaseous ions.
- To form Mg²⁺(g) from Mg(g), include both first and second ionisation steps. The supplied total is 738+1451=2189 kJ mol⁻¹.
- Both steps are endothermic. Omitting the second ionisation would leave the wrong gaseous charge state and an incomplete Born–Haber route.
Supplied magnesium ionisation steps
Use a signed electron-affinity convention
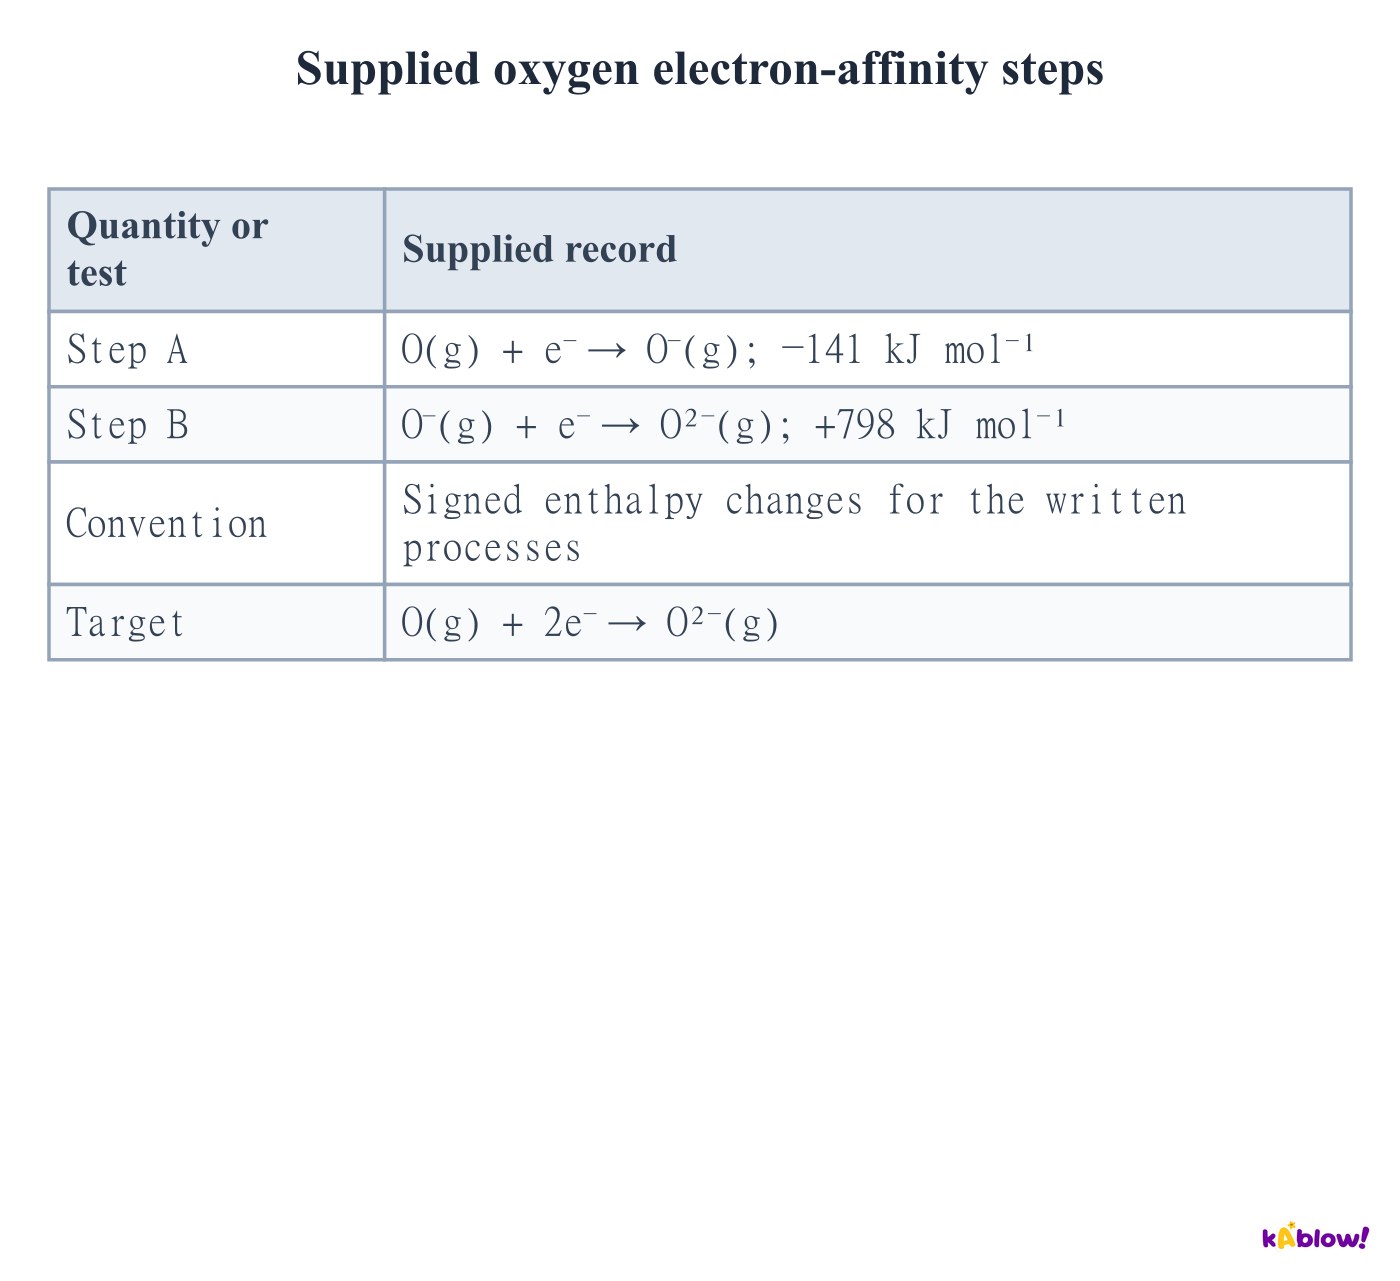
- An electron-affinity step adds an electron to a gaseous atom or ion. Here values are signed enthalpy changes for the equation as written.
- The first oxygen step is exothermic in the supplied data, while adding another electron to O⁻ is endothermic because the incoming electron encounters an already negative ion.
- The overall O(g)+2e⁻→O²⁻(g) change is the sum −141+798=+657 kJ mol⁻¹. A stable oxide lattice can compensate for the energy cost of producing its gaseous ions.
Supplied oxygen electron-affinity steps
Separate lattice formation from lattice dissociation
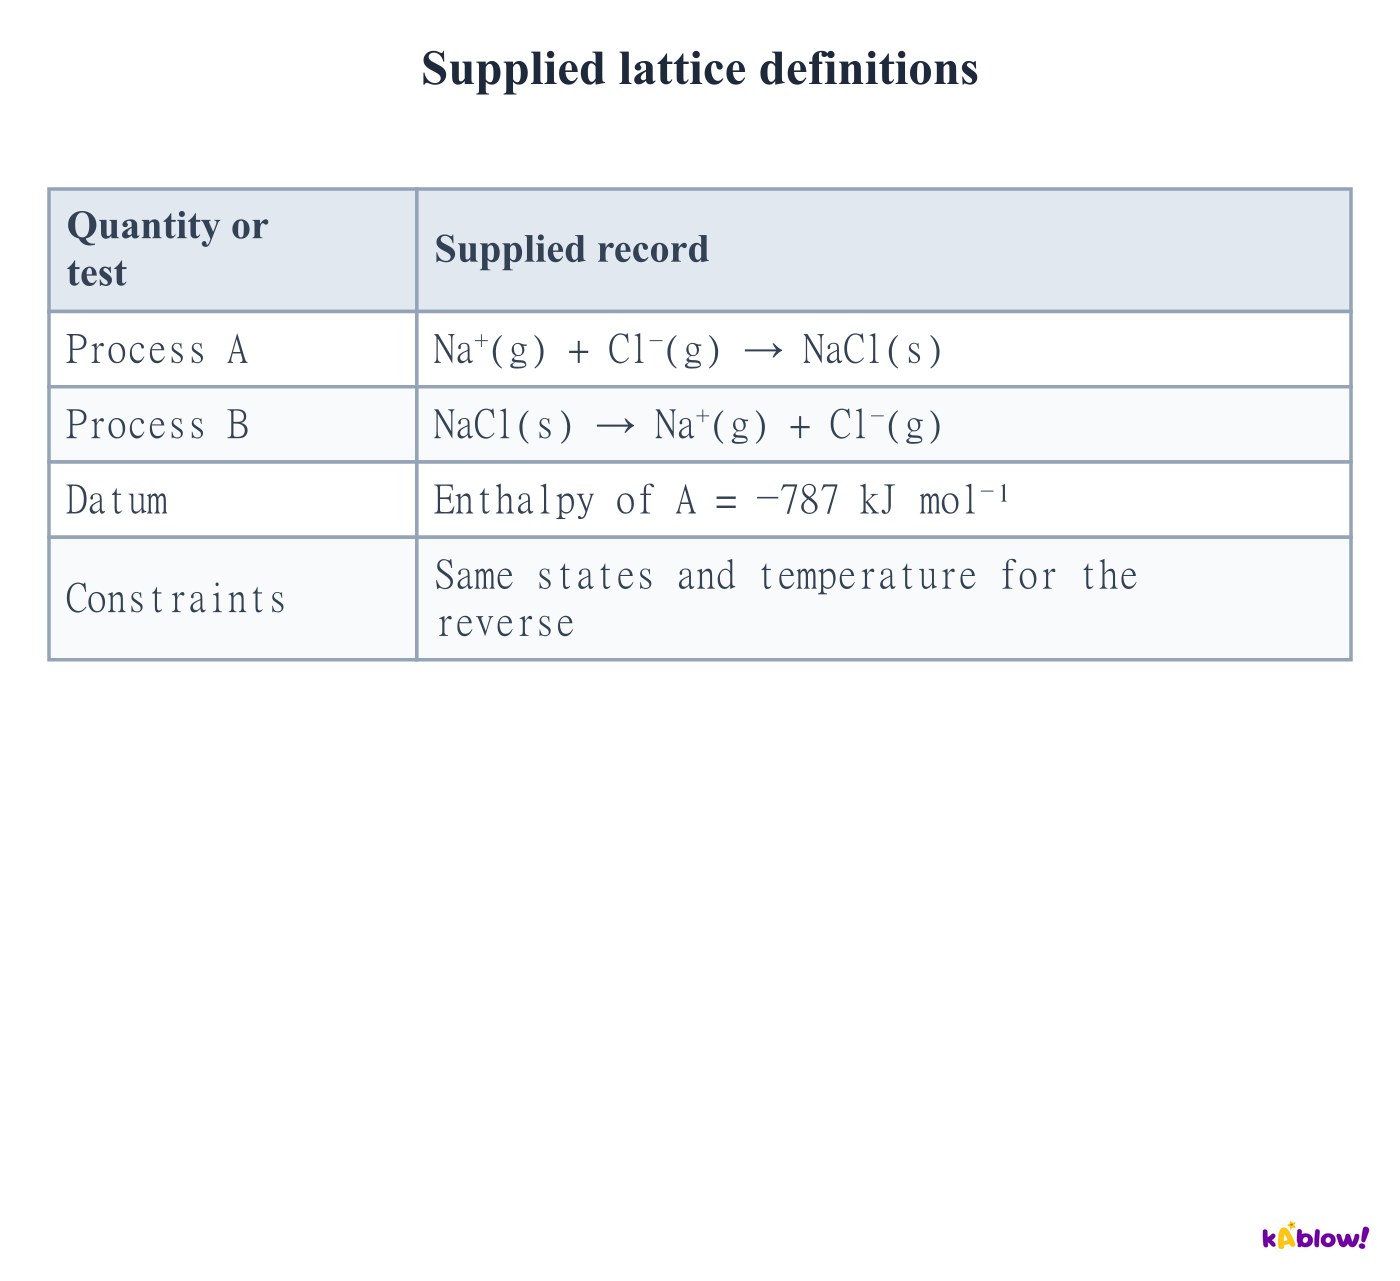
- Lattice formation produces one mole of ionic solid from its separated gaseous ions. Lattice dissociation is the reverse process to the same gaseous states.
- For the supplied NaCl model, formation is −787 kJ mol⁻¹ and dissociation is +787 kJ mol⁻¹. The reversal changes the sign, not the magnitude.
- Check which definition is used before adding a lattice term to a cycle. A quoted positive magnitude must not be inserted as a negative formation value without stating that conversion.
Supplied lattice definitions
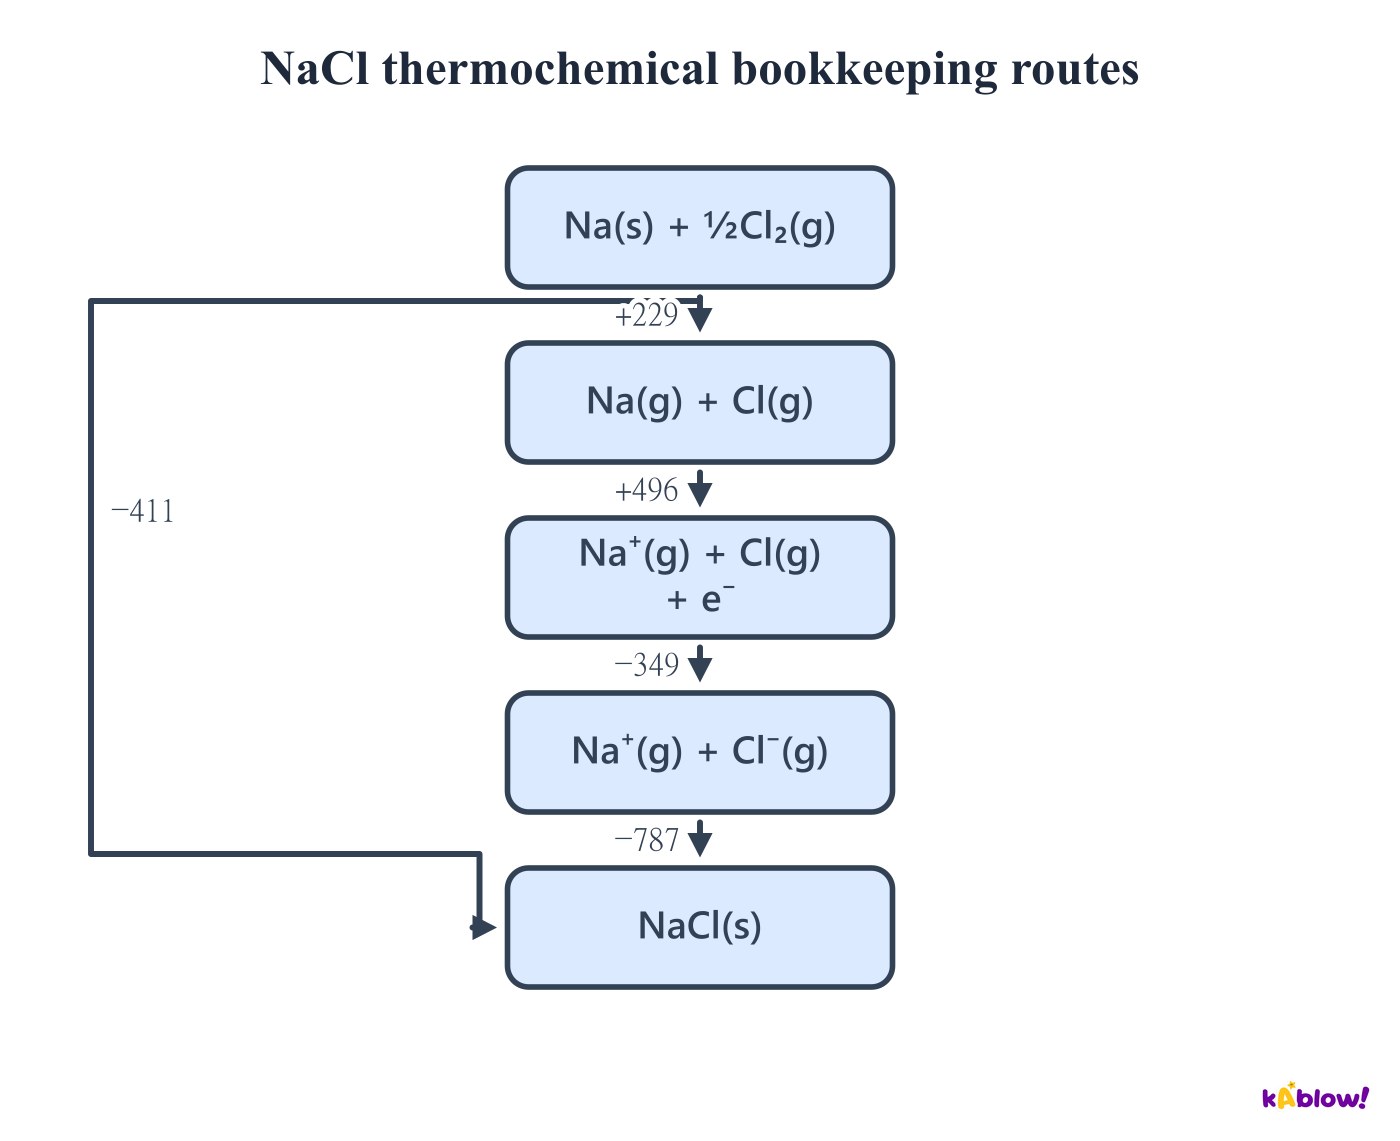
Connect two Born–Haber routes with the same endpoints
- The supplied route diagram connects reference-state elements to solid NaCl directly and through gaseous atoms and ions. All edge values are in kJ mol⁻¹ of NaCl formed.
- The indirect signed sum 229+496−349−787 equals the direct−411. Each node retains all species needed for its stage, including the electron between ionisation and electron attachment.
- This is a thermochemical bookkeeping diagram, not a reaction mechanism or an energy-height plot. Its page directions do not mean every downward drawn edge is exothermic.
NaCl thermochemical bookkeeping routes
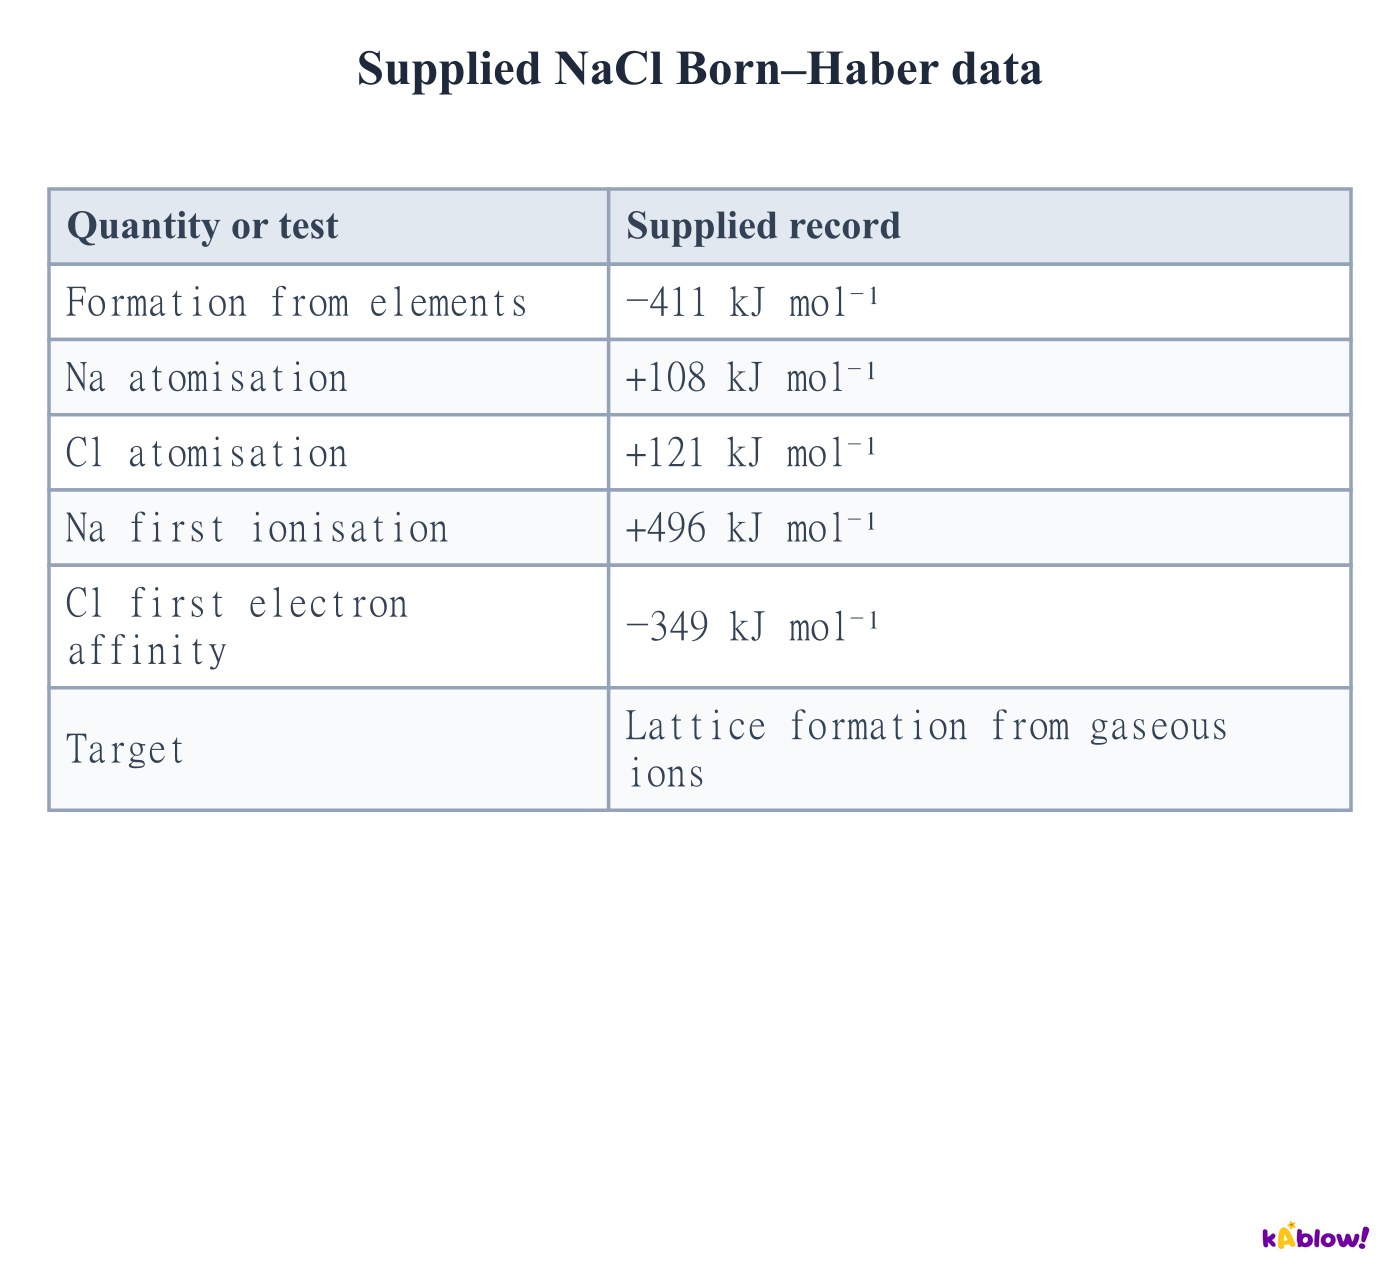
Calculate a lattice term by Hess’s law
- For NaCl, add sodium atomisation, chlorine atomisation, sodium ionisation and chlorine electron affinity before the lattice-formation step.
- The supplied pre-lattice total is 108+121+496−349=376 kJ mol⁻¹. To reach the formation endpoint−411, lattice formation is −411−376=−787 kJ mol⁻¹.
- Retain signs in brackets and check the endpoint equation. Use one internally consistent set of supplied data rather than mixing rounded values from different tables.
Supplied NaCl Born–Haber data
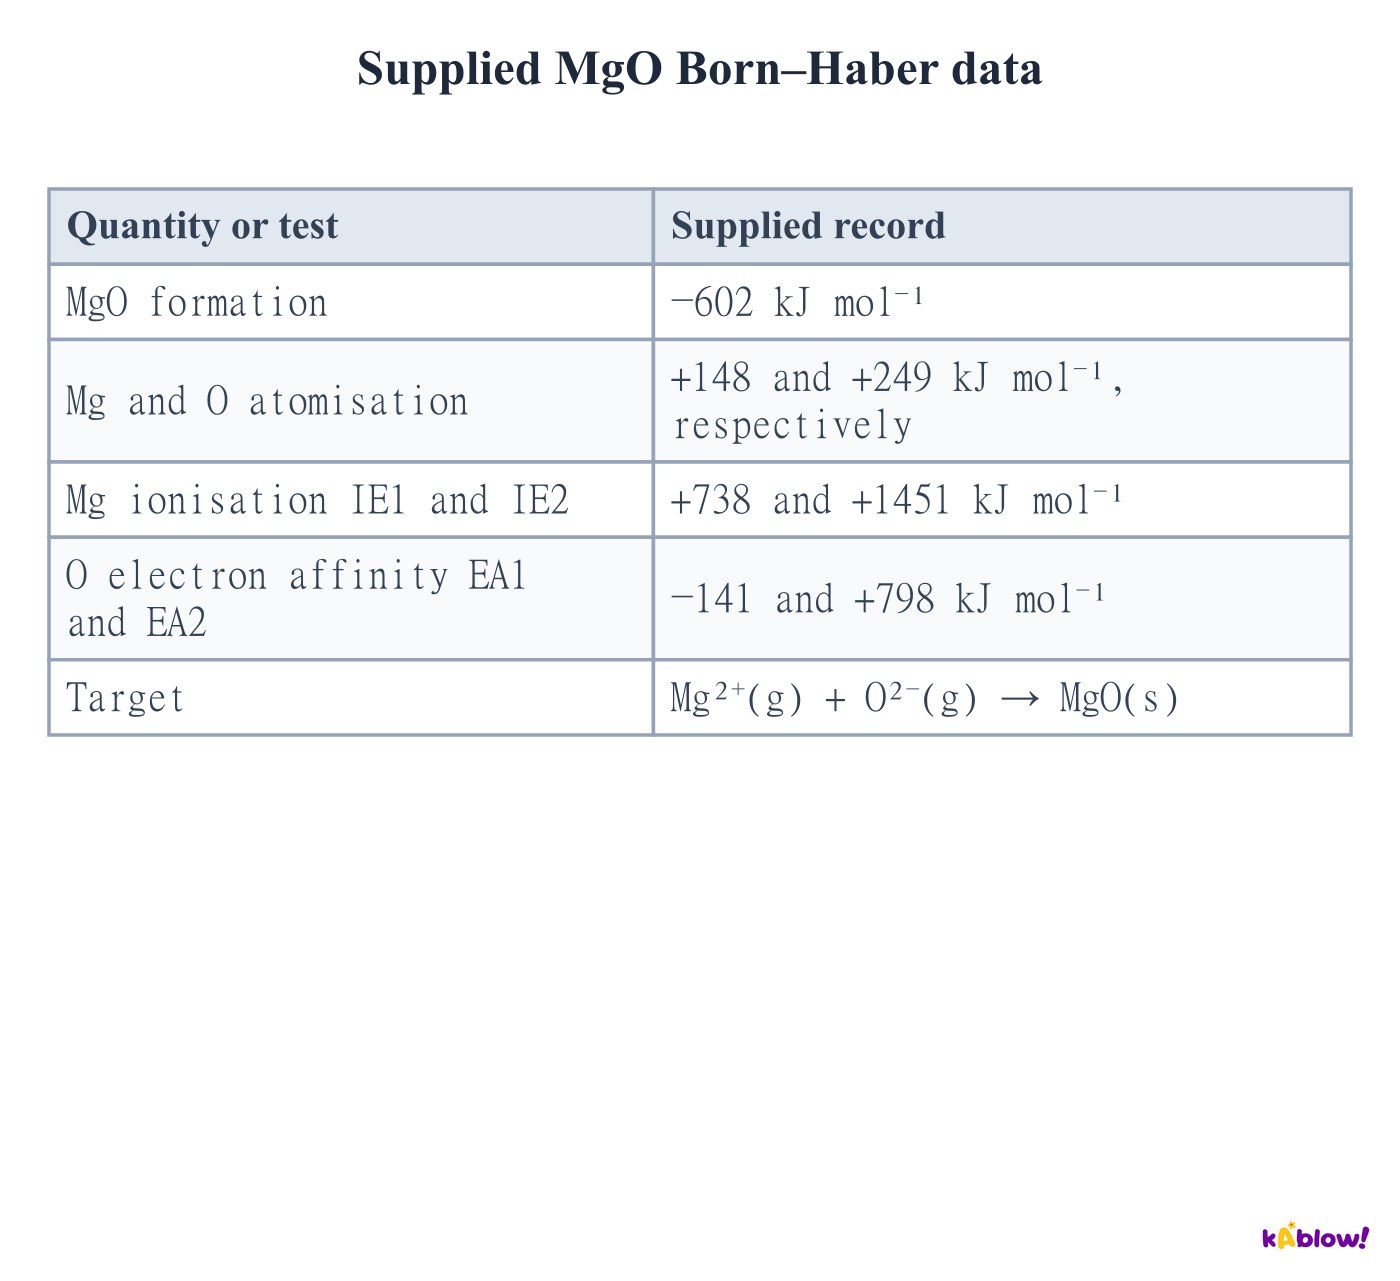
Include both charge-building steps for magnesium oxide
- Forming Mg²⁺ requires two magnesium ionisations; forming O²⁻ requires both oxygen electron-affinity steps. Oxygen atomisation is already per mole of atoms.
- The supplied pre-lattice sum is 148+249+738+1451−141+798=3243 kJ mol⁻¹. With formation−602, lattice formation is −3845 kJ mol⁻¹.
- Check gas-ion charges and the electron count before calculating. Omitting an endothermic second electron affinity creates a large sign and magnitude error.
Supplied MgO Born–Haber data
Scale cycle terms by the formula stoichiometry
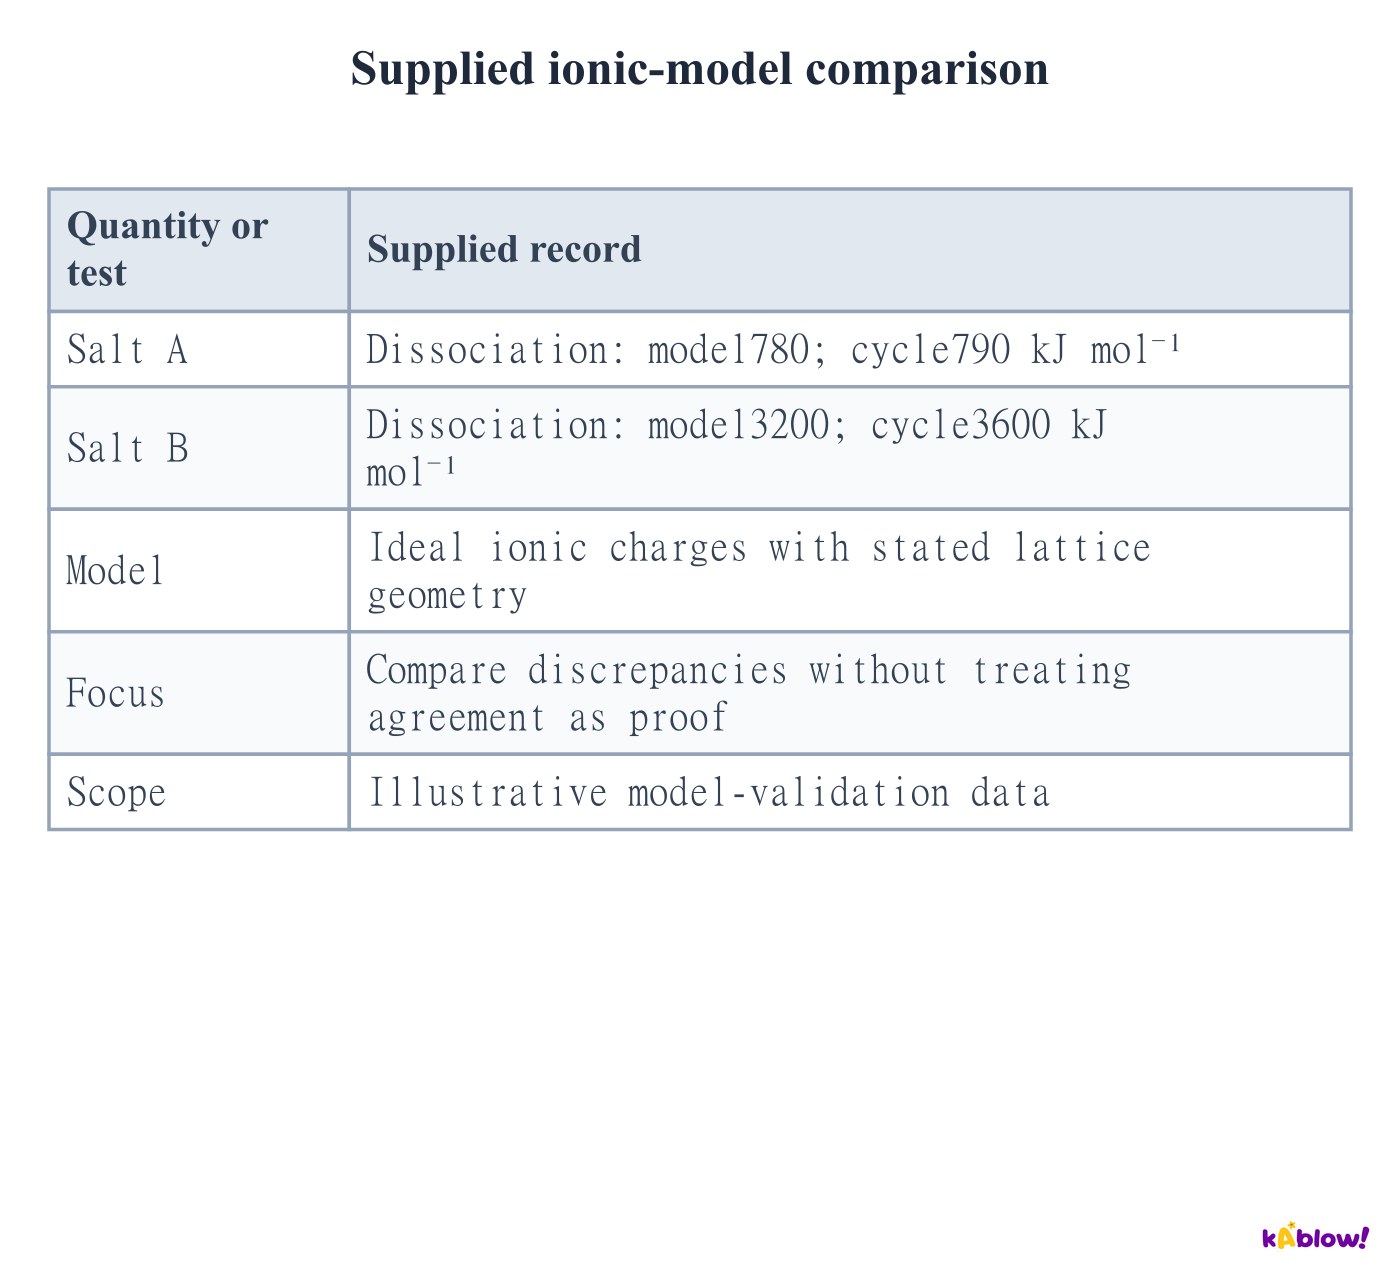
- One mole of MgCl₂ contains one mole of Mg²⁺ and two moles of Cl⁻. Each cycle term must correspond to those amounts.
- If chlorine atomisation is supplied per mole of chlorine atoms, use it twice. Likewise use twice the first chlorine electron-affinity value, with magnesium IE1 andIE2 once each.
- Do not double the whole magnesium contribution or insert a second chlorine electron affinity: two different chlorine atoms each accept one electron.
Supplied MgCl₂ cycle multiplicities
Infer an unknown electron-affinity term
- A Born–Haber cycle can determine any missing leg when the other terms and endpoints are known. The unknown need not be called the direct route.
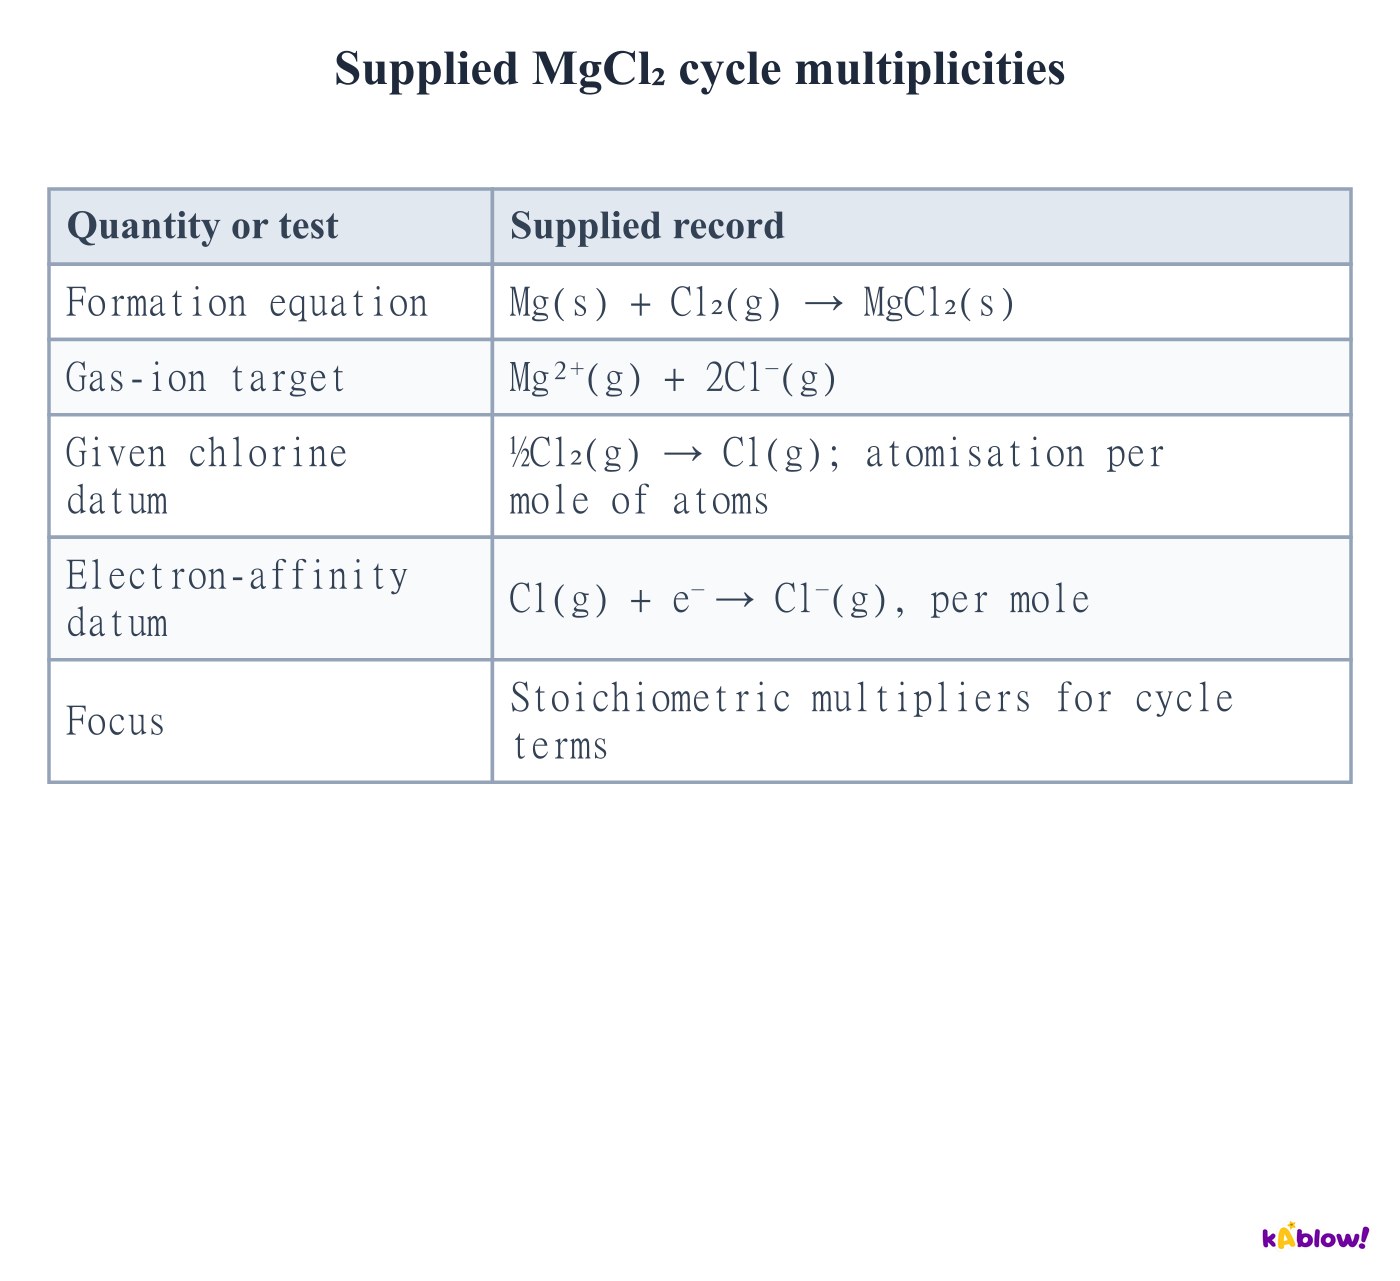
- For the supplied illustrative XCl data,−400=100+120+500+EA−800. Rearranging gives EA=−320 kJ mol⁻¹.
- Keep the target process direction explicit. A released-energy magnitude and a signed attachment enthalpy would use different sign conventions.
Supplied unknown-affinity cycle
Compare ionic charge and separation under a stated model
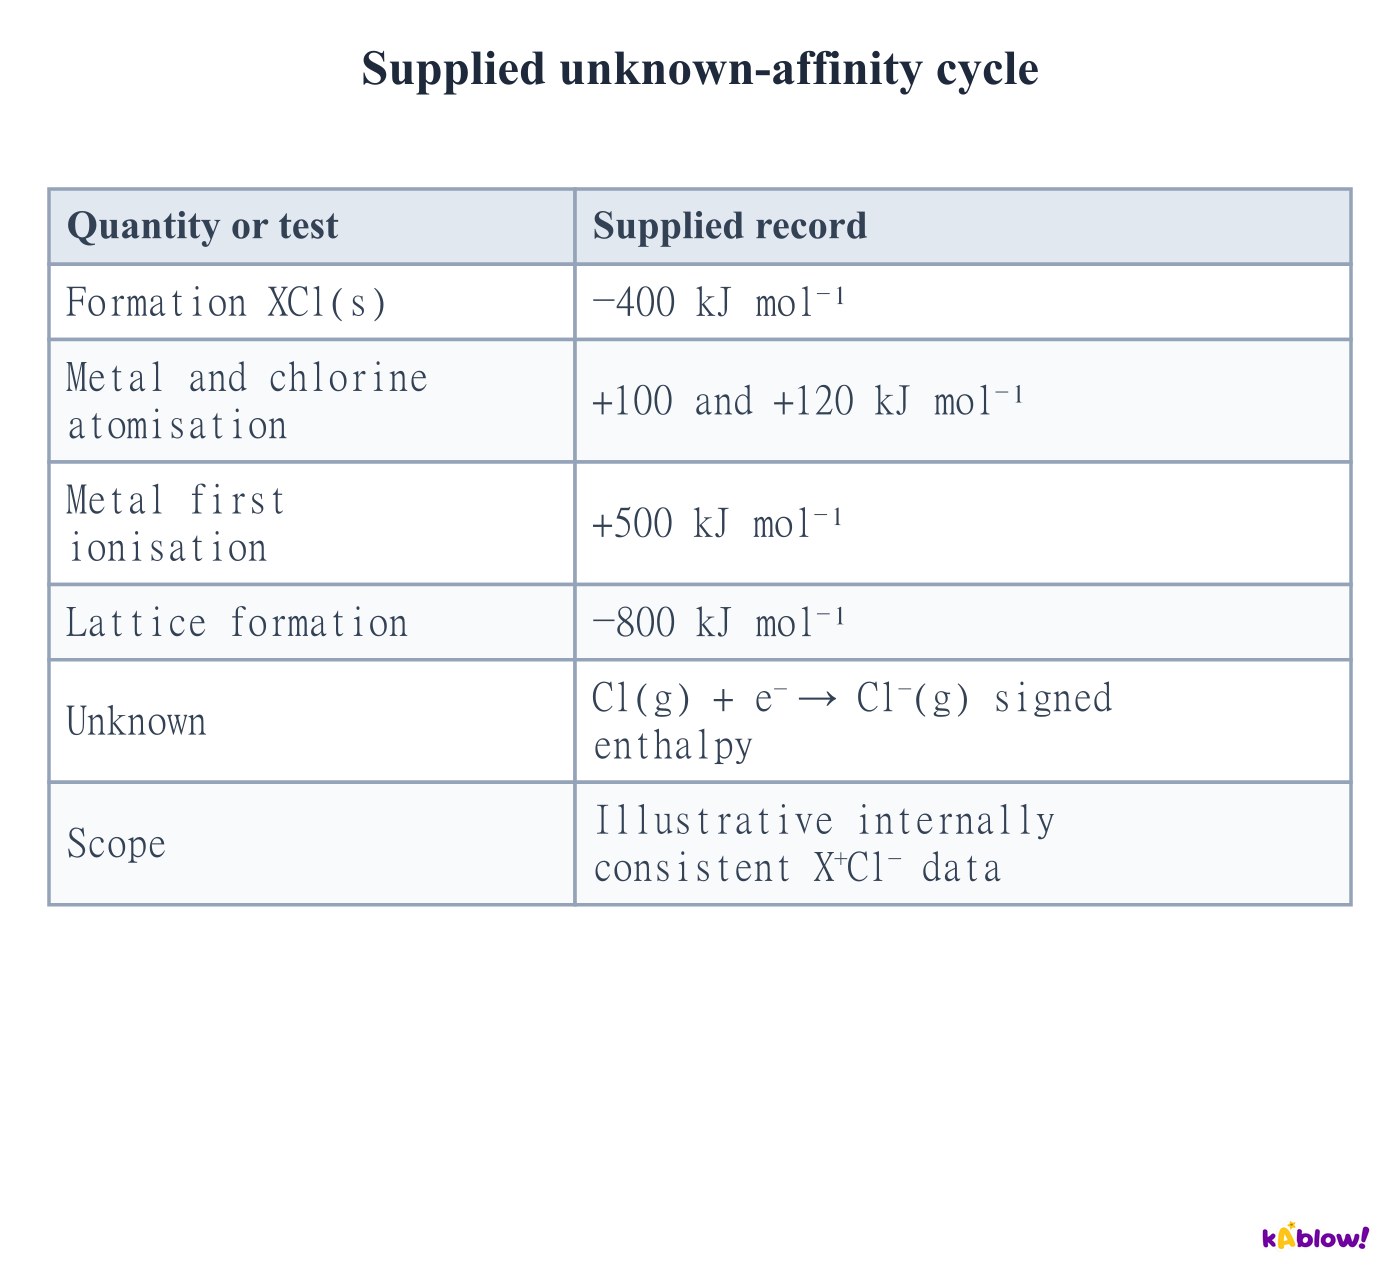
- For comparable lattice structures, greater opposite-charge product and smaller ion-centre separation usually give stronger electrostatic attraction and a larger lattice-enthalpy magnitude.
- The supplied point-charge pairs isolate these factors. Increasing separation weakens attraction; changing both ion charges from unit to double increases their charge product.
- Real lattice enthalpies also depend on geometry, repulsion and bonding character. Do not apply a radius-only rule across unrelated structures without stating its limits.
Supplied comparable ionic-lattice pairs
Evaluate agreement with an ideal ionic model
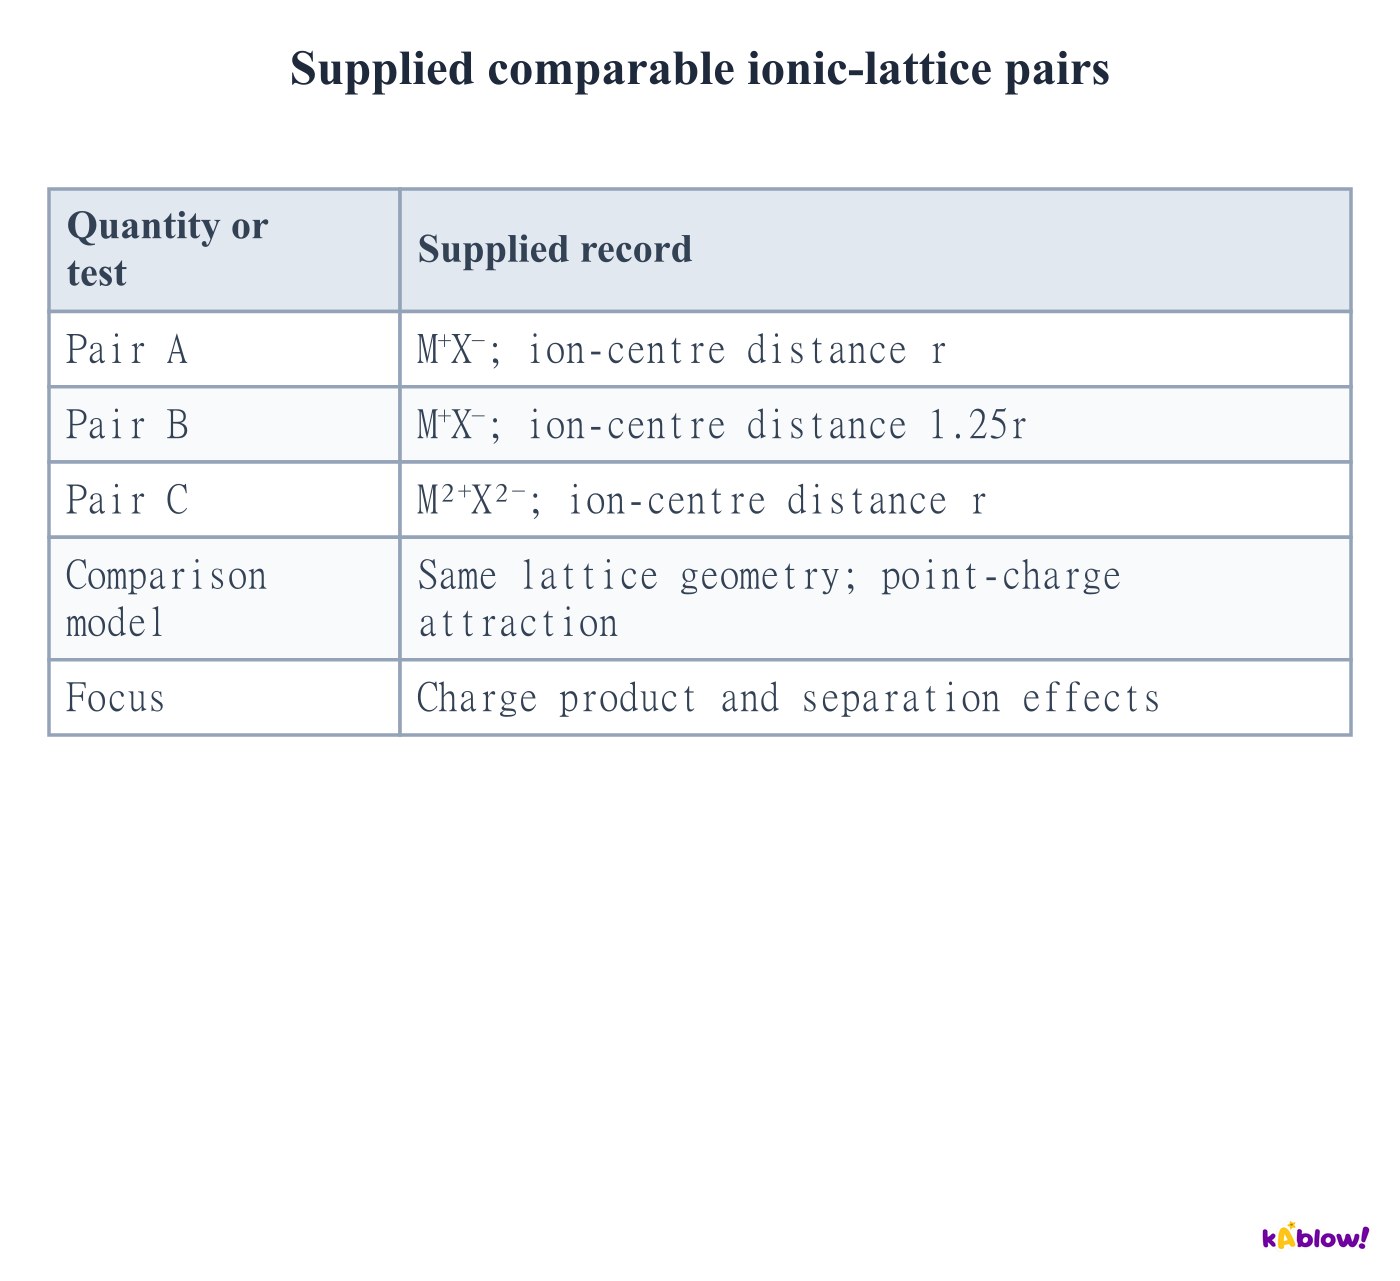
- An ideal ionic calculation can be compared with a Born–Haber value inferred from experimental thermochemical data.
- Close agreement supports the model as a useful approximation; it does not prove zero covalent character. A large discrepancy may indicate polarisation and covalent contribution, alongside other model limitations.
- In the supplied comparison, salt B has a larger absolute and relative discrepancy thanA. Judge the stated model and data rather than declaring a compound purely ionic from one agreement.
Supplied ionic-model comparison
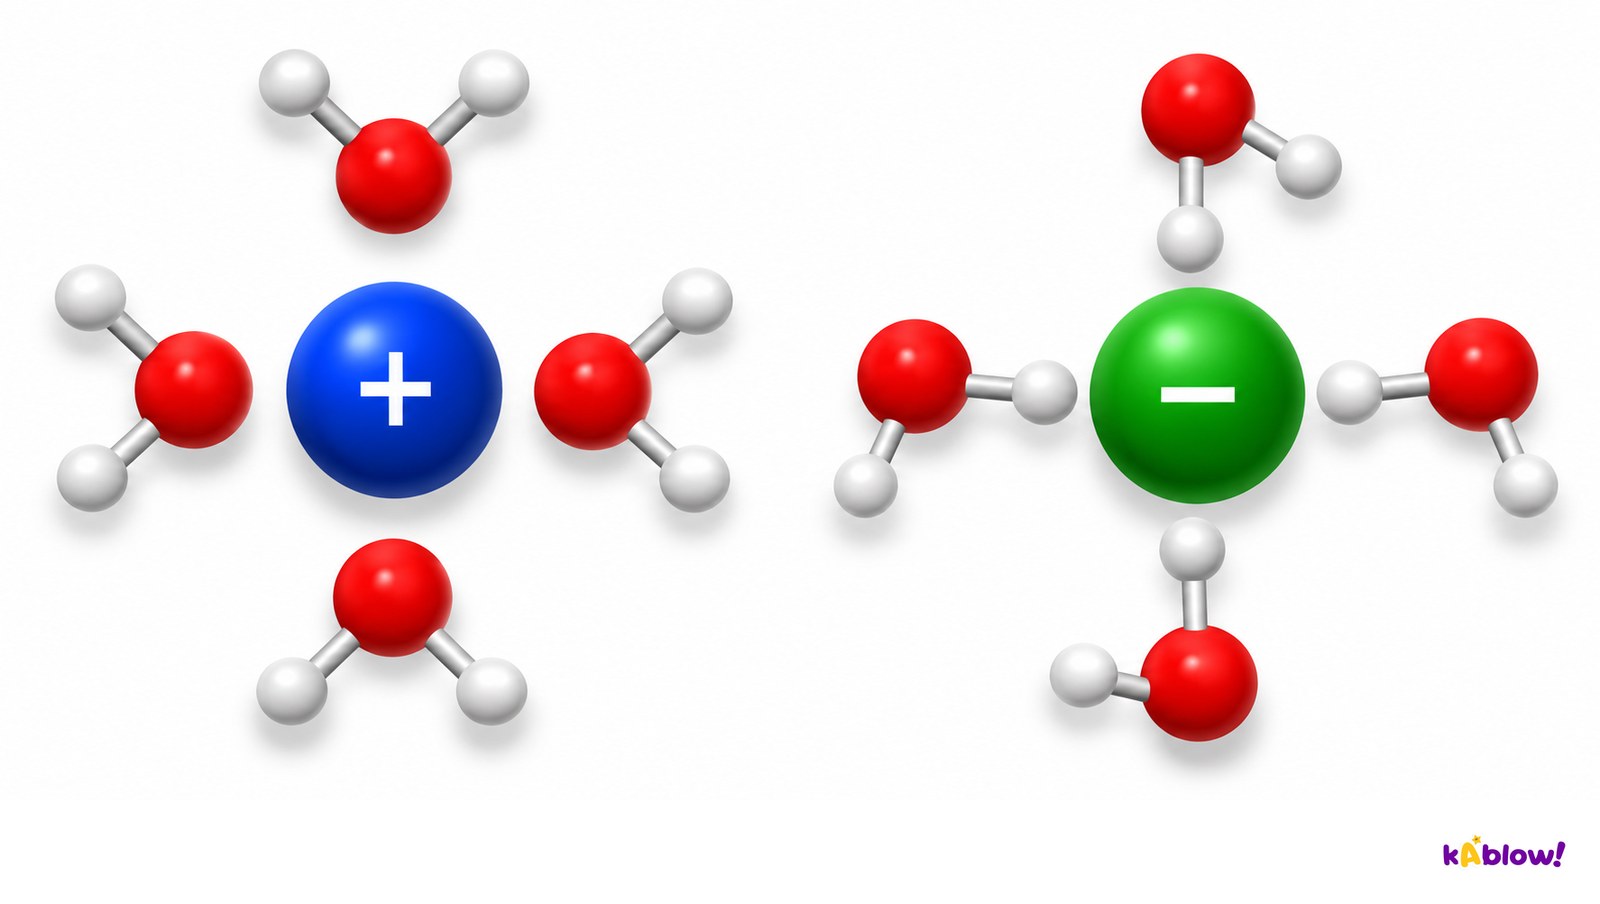
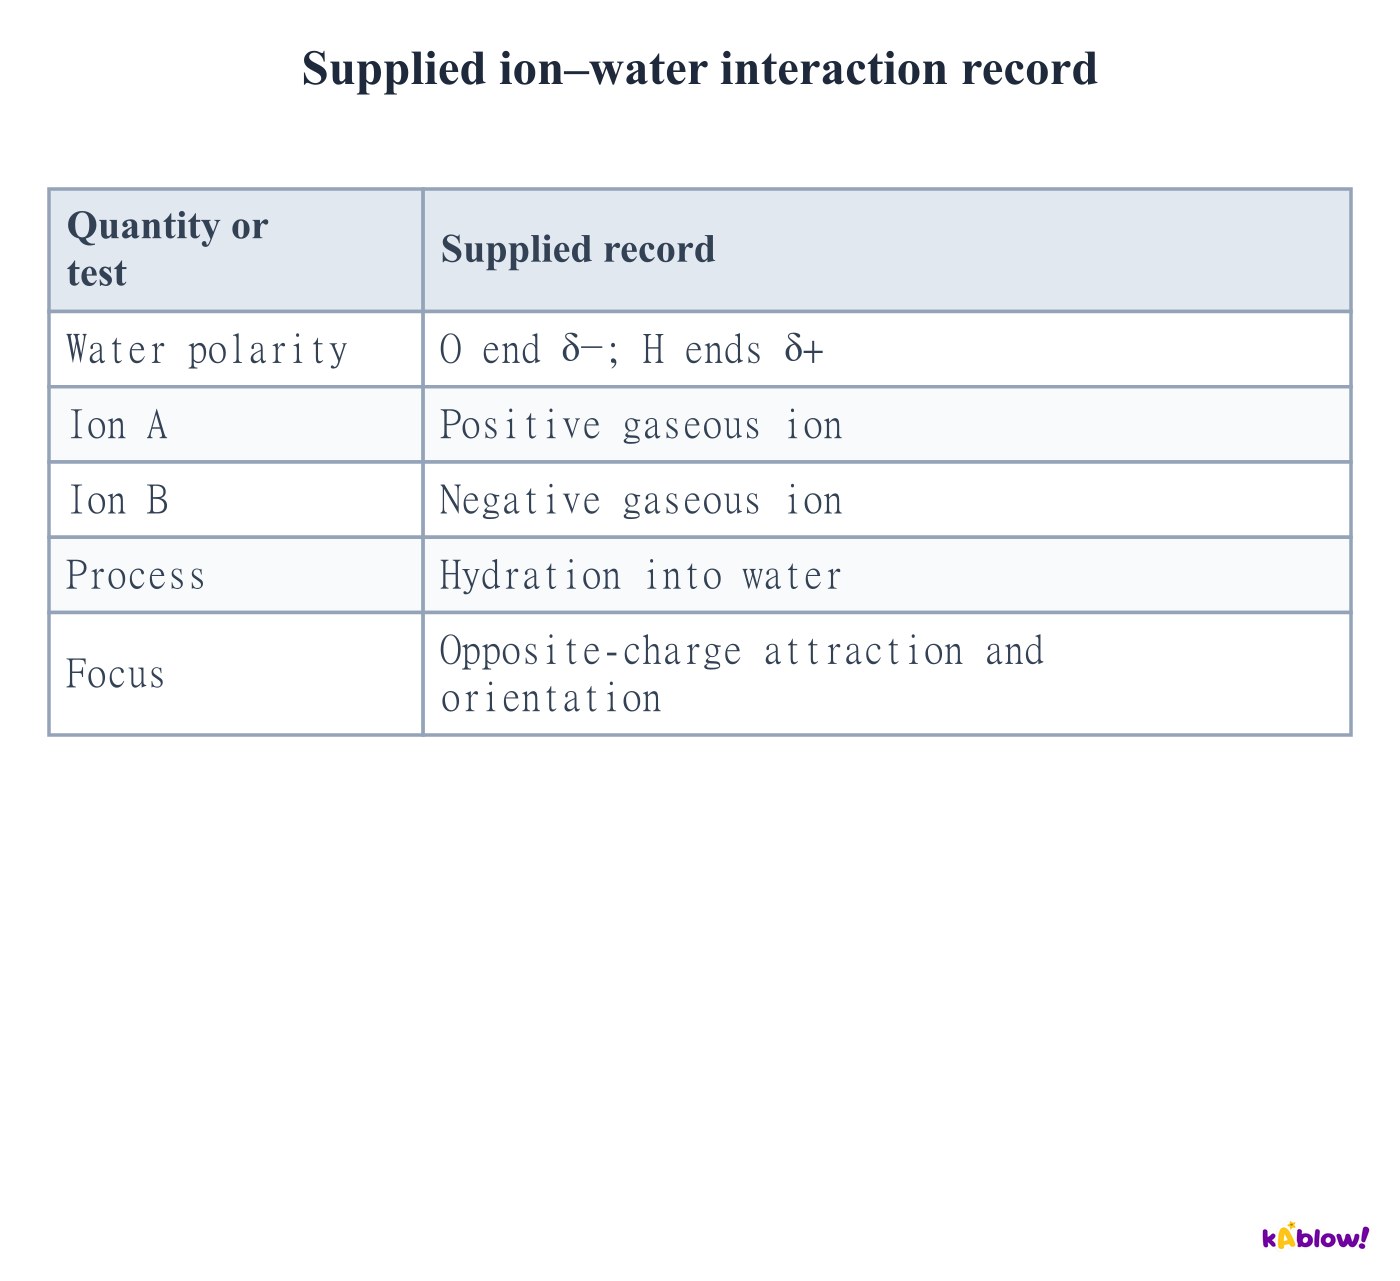
Explain ion hydration and water orientation
- Hydration transfers a specified gaseous ion into aqueous surroundings. Ion–dipole attractions form as polar water molecules arrange around the ion.
- Water’s oxygen end is partially negative and faces a positive ion; a hydrogen end is partially positive and faces a negative ion. The illustration is a simplified orientation snapshot, not a fixed hydration-number claim.
- Dissolving an ionic crystal separates its existing ions and hydrates them. The symbol(aq) means aqueous; it does not by itself certify infinite dilution or a particular hydration coordination number.
Water orientation around positive and negative ions
Relate dissolution to lattice separation and hydration
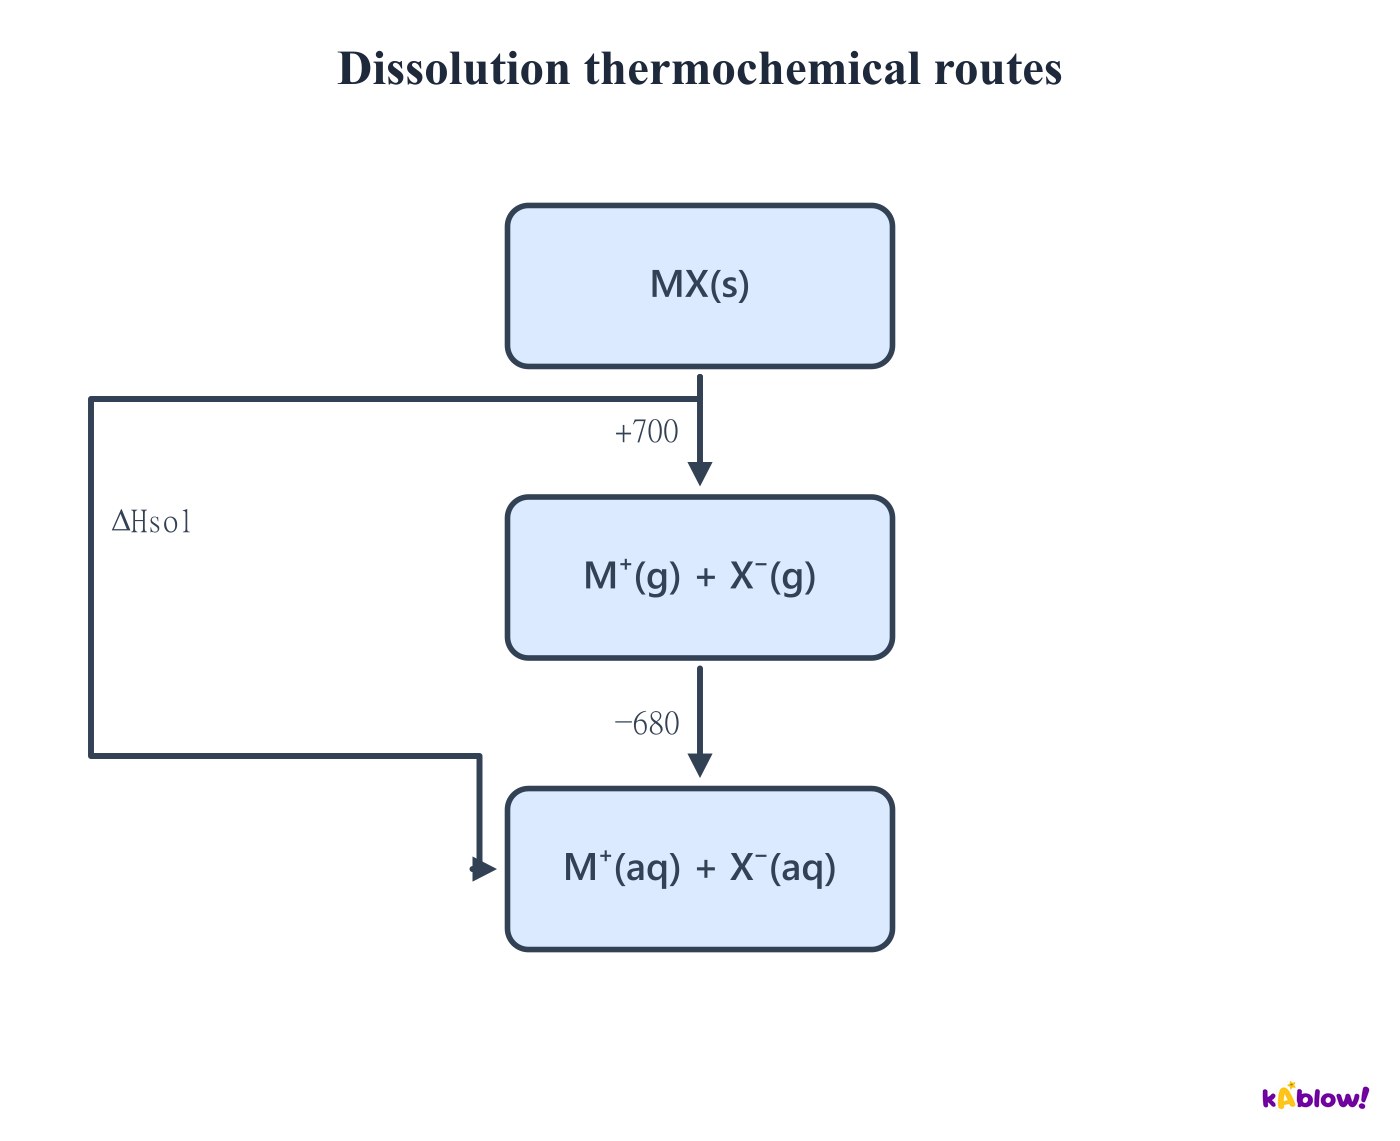
- Dissolution can be analysed through a route from ionic solid to gaseous ions and then to hydrated ions. It is a Hess route rather than a claim about the actual microscopic mechanism.
- Using lattice dissociation as positive, ΔHsolution=ΔHlattice,dissociation+ΣΔHhydration. Multiply each ion’s hydration term by its stoichiometric coefficient.
- The supplied schematic route has+700 and−680 kJ mol⁻¹, so its net solution change is +20. With formation lattice enthalpy instead, reverse that term’s sign first.
Dissolution thermochemical routes
Calculate an unknown hydration enthalpy
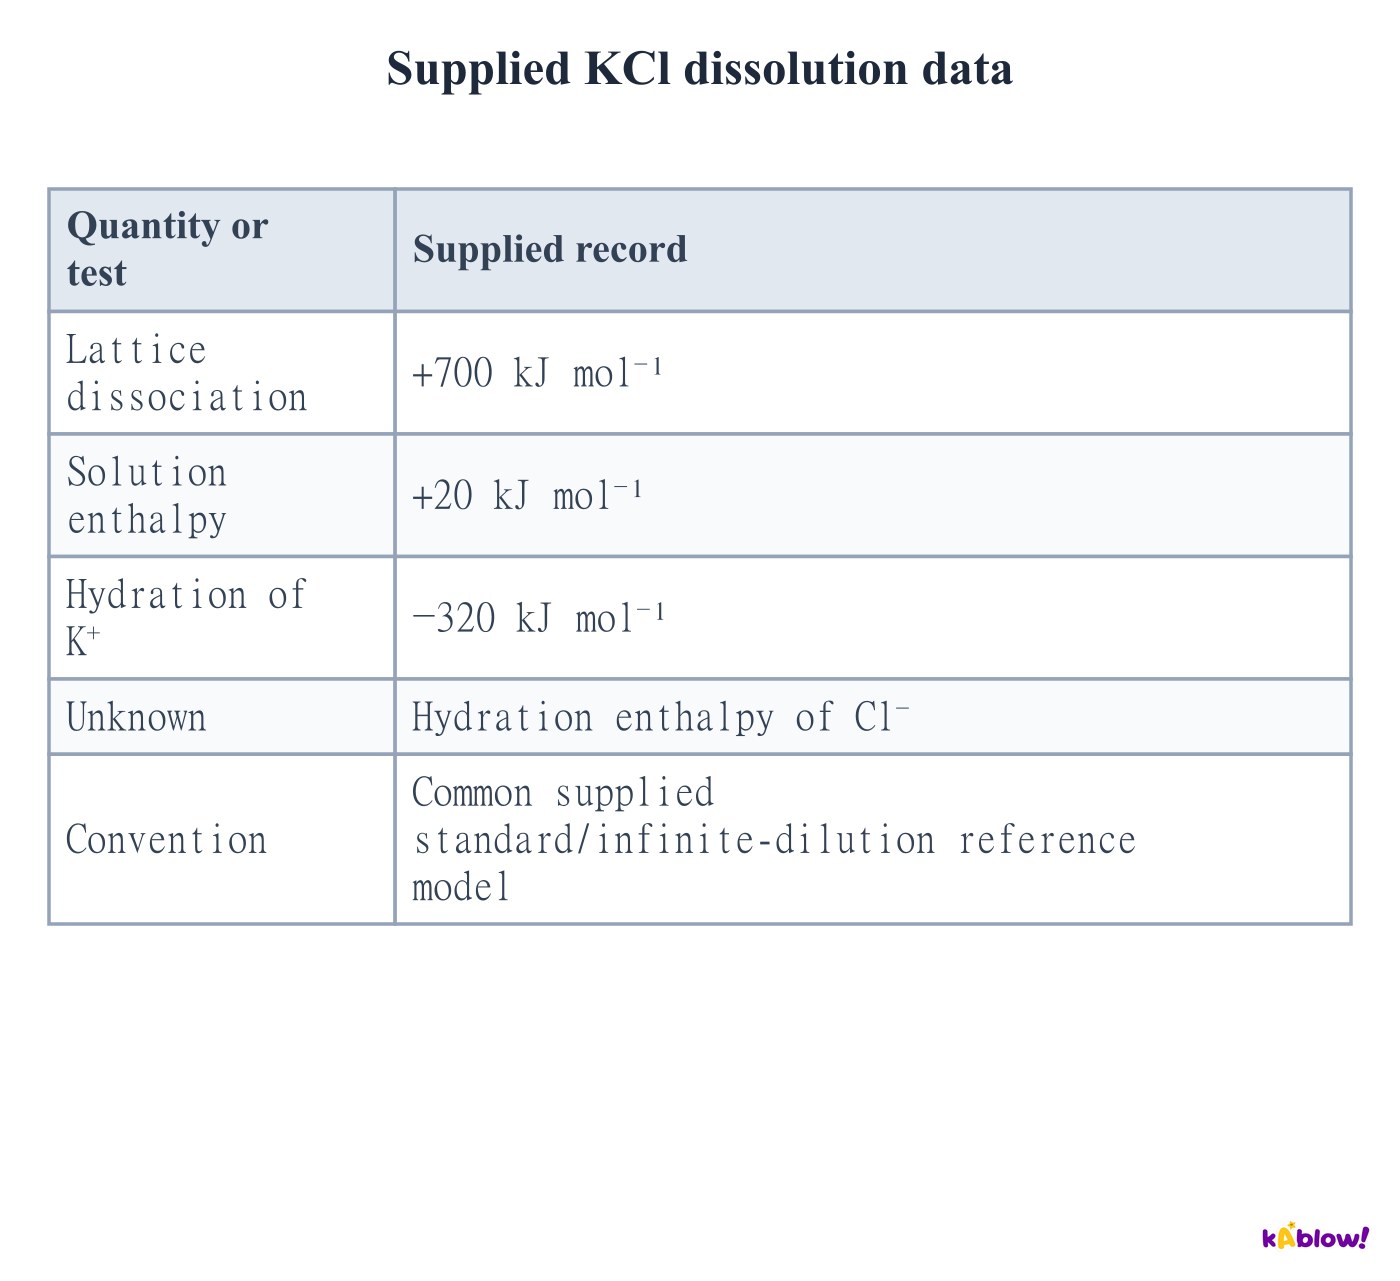
- The supplied KCl dissolution gives 20=700+(−320)+ΔHhyd(Cl⁻), with every value in kJ mol⁻¹ on the stated reference convention.
- The chloride term is therefore−360 kJ mol⁻¹. The combined hydration release−680 partially offsets the lattice-separation cost+700.
- Single-ion hydration values use a convention; retain the supplied consistent set. The total solution enthalpy can be positive even though hydration releases energy.
Supplied KCl dissolution data
Include multiple ion hydration contributions
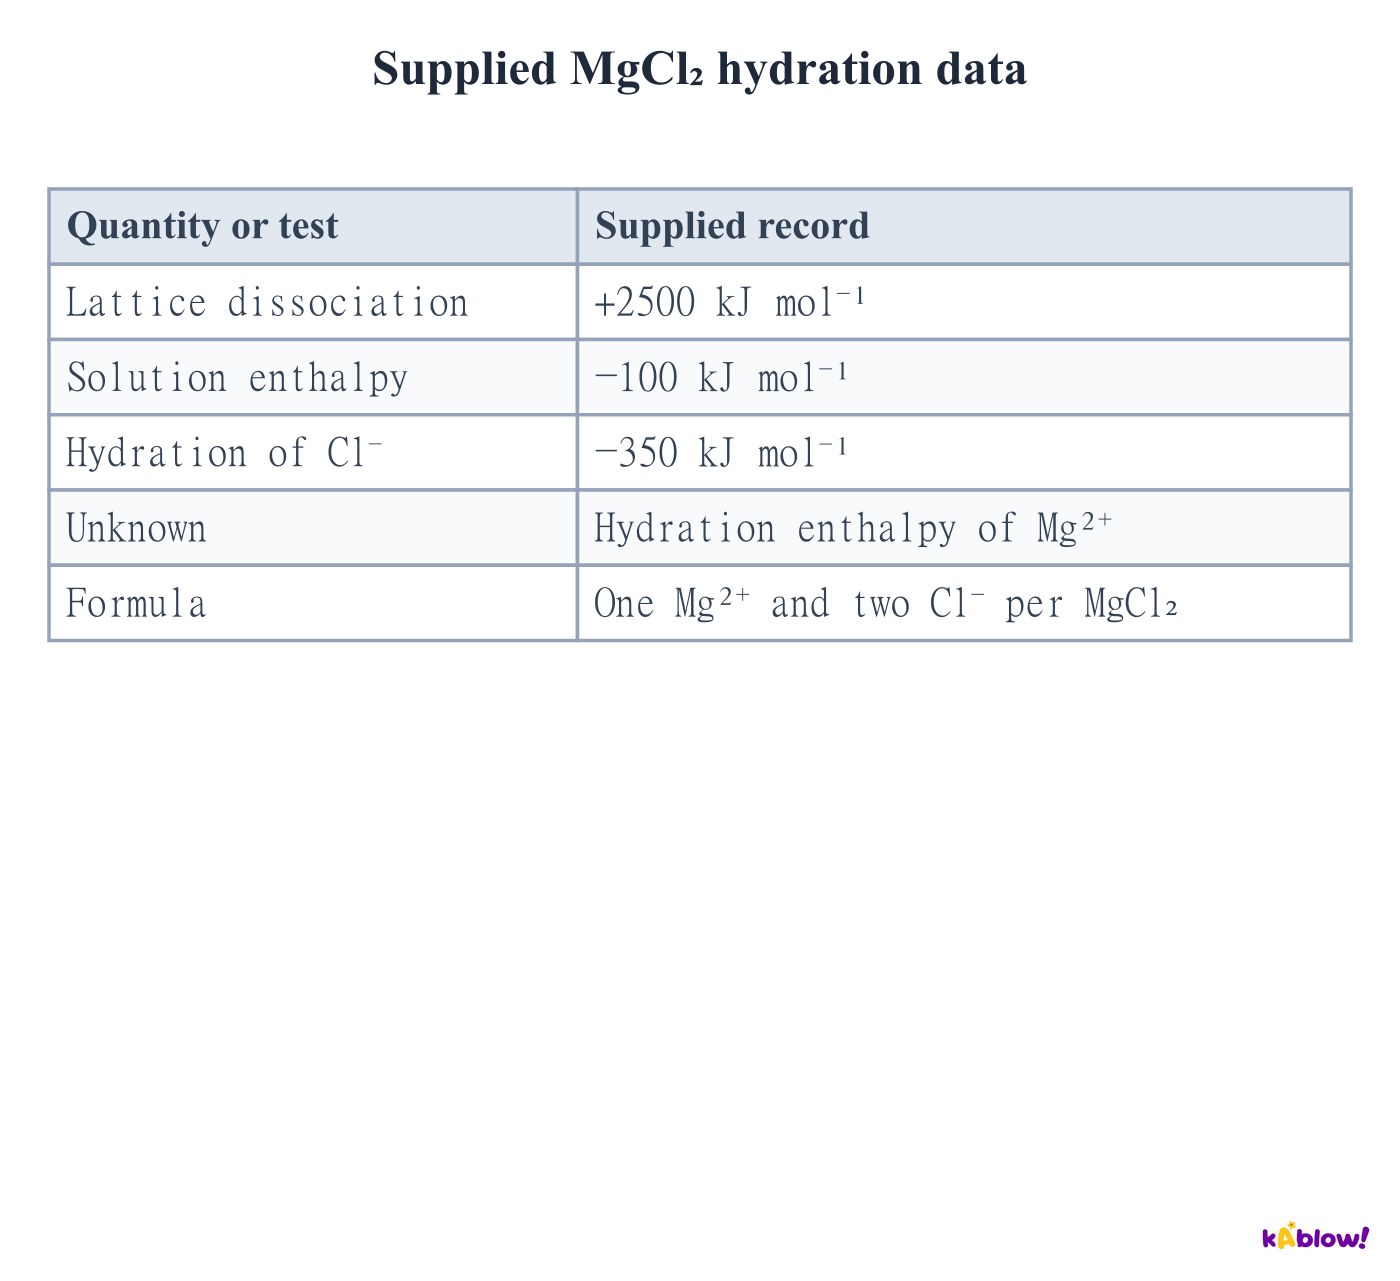
- For MgCl₂ there are two chloride hydration terms per formula unit. The supplied balance is −100=2500+ΔHhyd(Mg²⁺)+2(−350).
- Rearranging gives magnesium-ion hydration−1900 kJ mol⁻¹. The total hydration term is −2600 and solution is −100.
- An omitted coefficient can leave an algebraically neat but chemically incorrect result. Recheck the dissolved ion formula before accepting the answer.
Supplied MgCl₂ hydration data
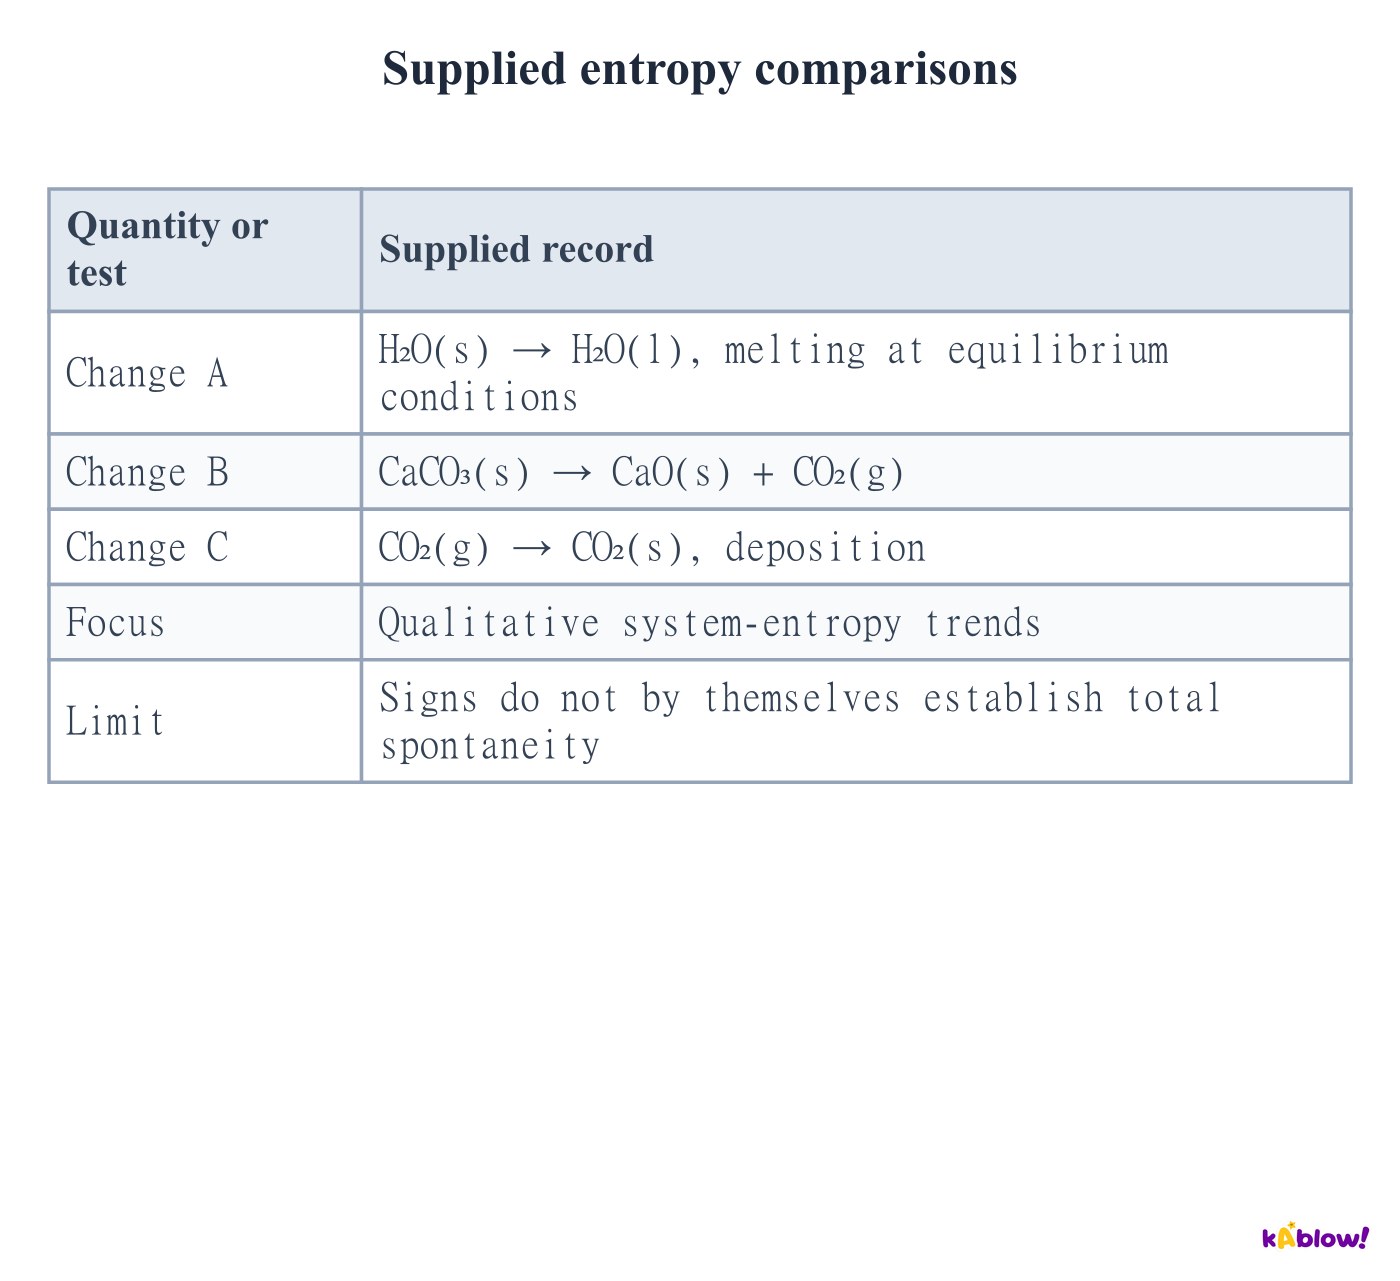
Interpret entropy through accessible states and energy dispersal
- Entropy relates to the number of accessible microscopic arrangements and energy dispersal. Visual mess is only a limited analogy; entropy is not literally a count of arrangements.
- Melting commonly increases a substance’s entropy, and forming gas from condensed reactants often gives a positive reaction-entropy contribution. Deposition from gas to solid commonly decreases it.
- These are system trends under the specified conditions. The system’s entropy change alone does not decide spontaneity of system plus surroundings.
Supplied entropy comparisons
Calculate a coefficient-weighted standard entropy change
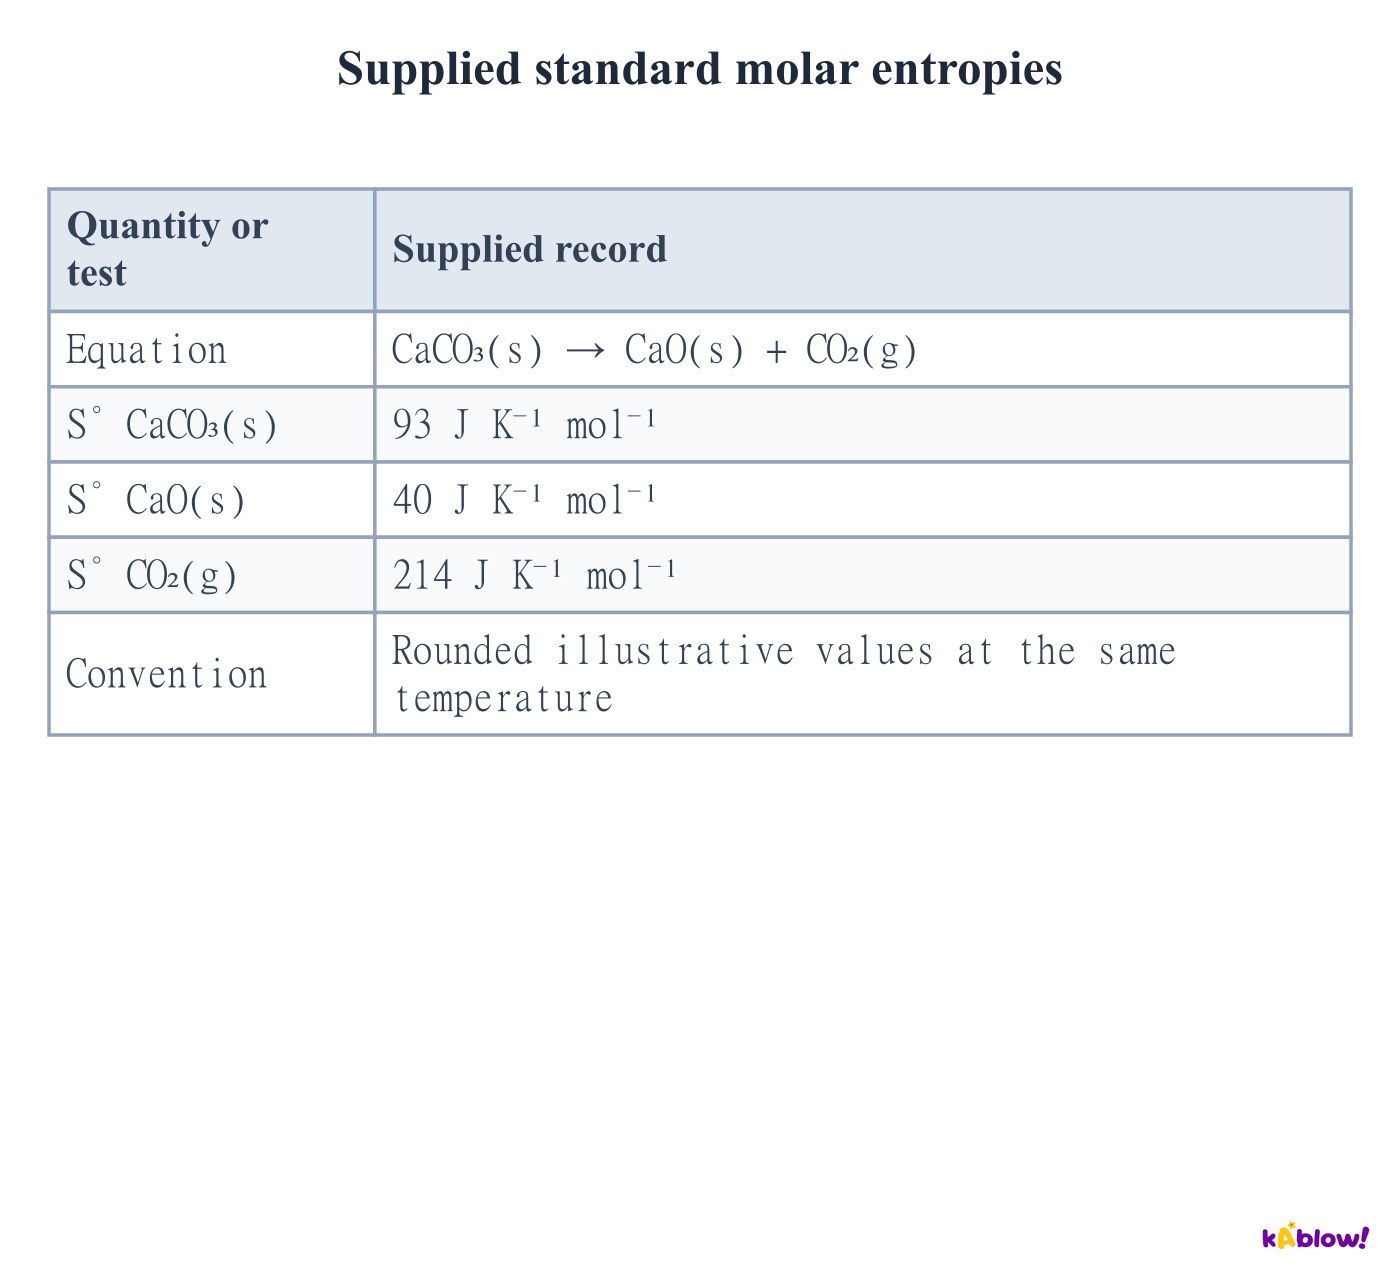
- Calculate standard reaction entropy as the product sum of stoichiometric coefficients times standard molar entropy, minus the corresponding reactant sum.
- For the supplied CaCO₃ decomposition, ΔS°=40+214−93=+161 J K⁻¹ mol⁻¹ of reaction as written.
- Absolute standard molar entropies of reference-state elements are not generally zero at ordinary temperatures. That zero convention belongs to formation enthalpies and formation free energies, not all thermodynamic properties.
Supplied standard molar entropies
Apply the second law to system plus surroundings
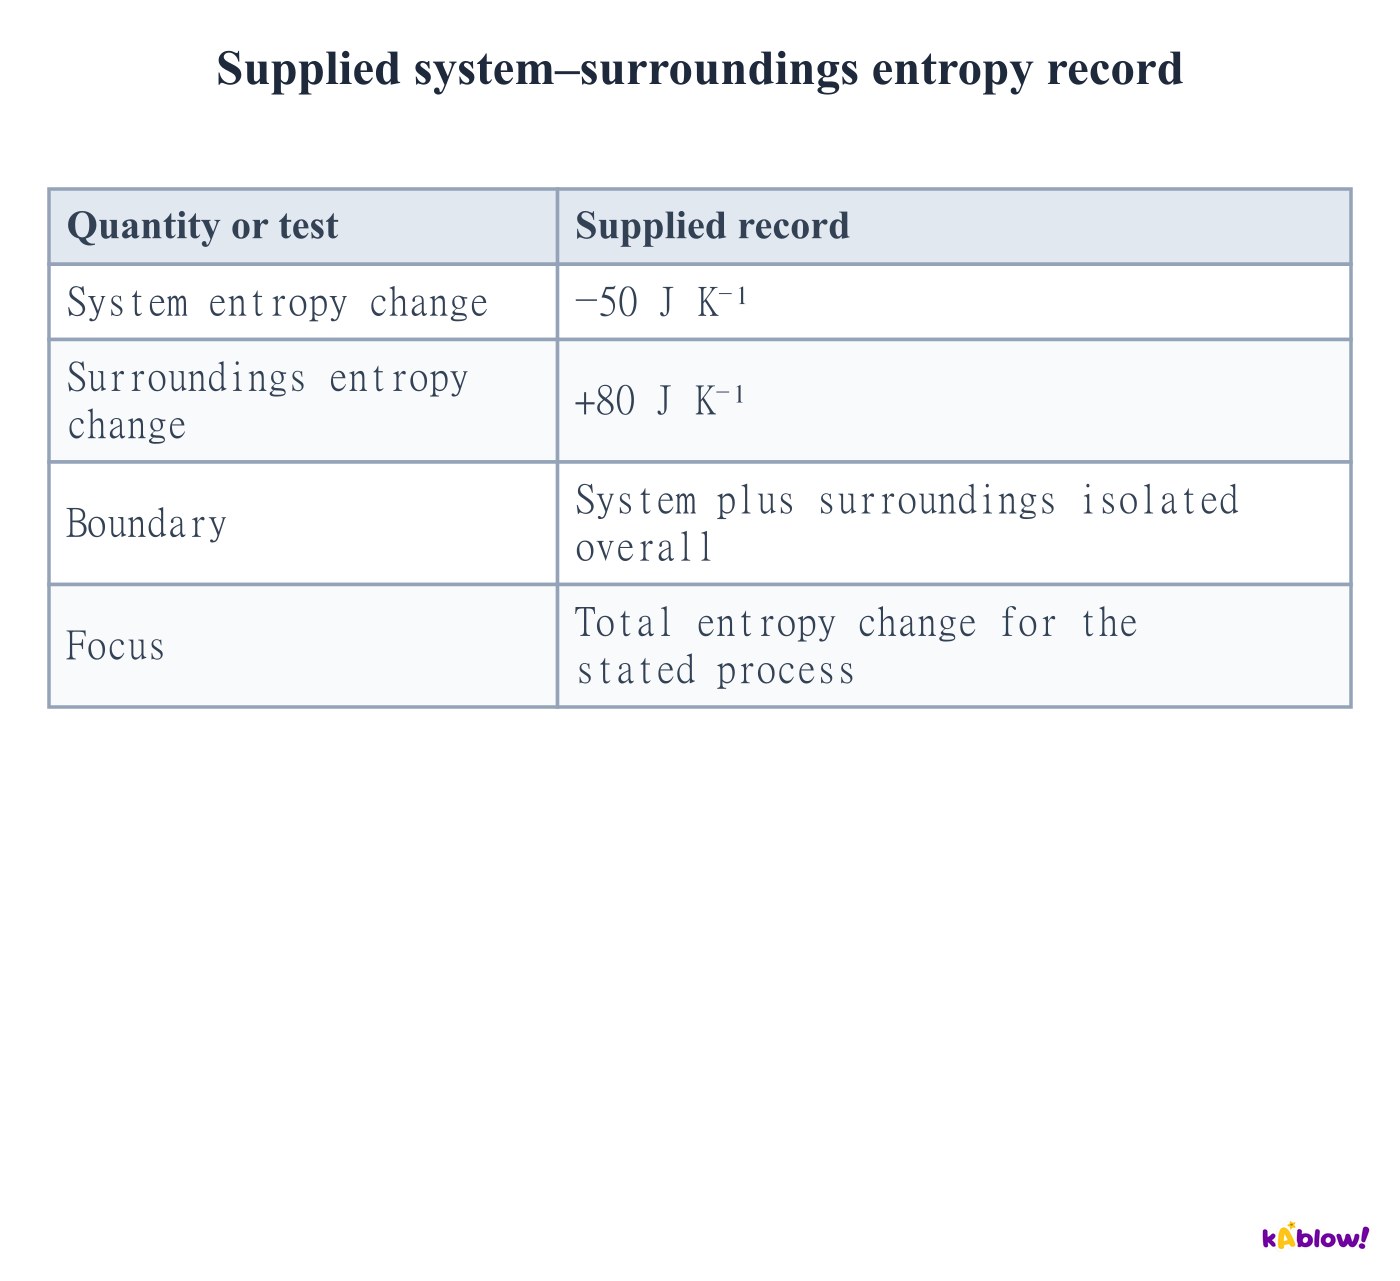
- The entropy of an isolated total system cannot decrease in an allowed spontaneous change. It increases for an irreversible spontaneous process and is unchanged in the reversible limit.
- The reacting subsystem can lose entropy while its surroundings gain more. Add both contributions when evaluating the isolated overall boundary.
- The supplied record has−50+80=+30 J K⁻¹ overall. It is consistent with an irreversible spontaneous change even though the subsystem entropy decreases.
Supplied system–surroundings entropy record
Use consistent units in the Gibbs equation
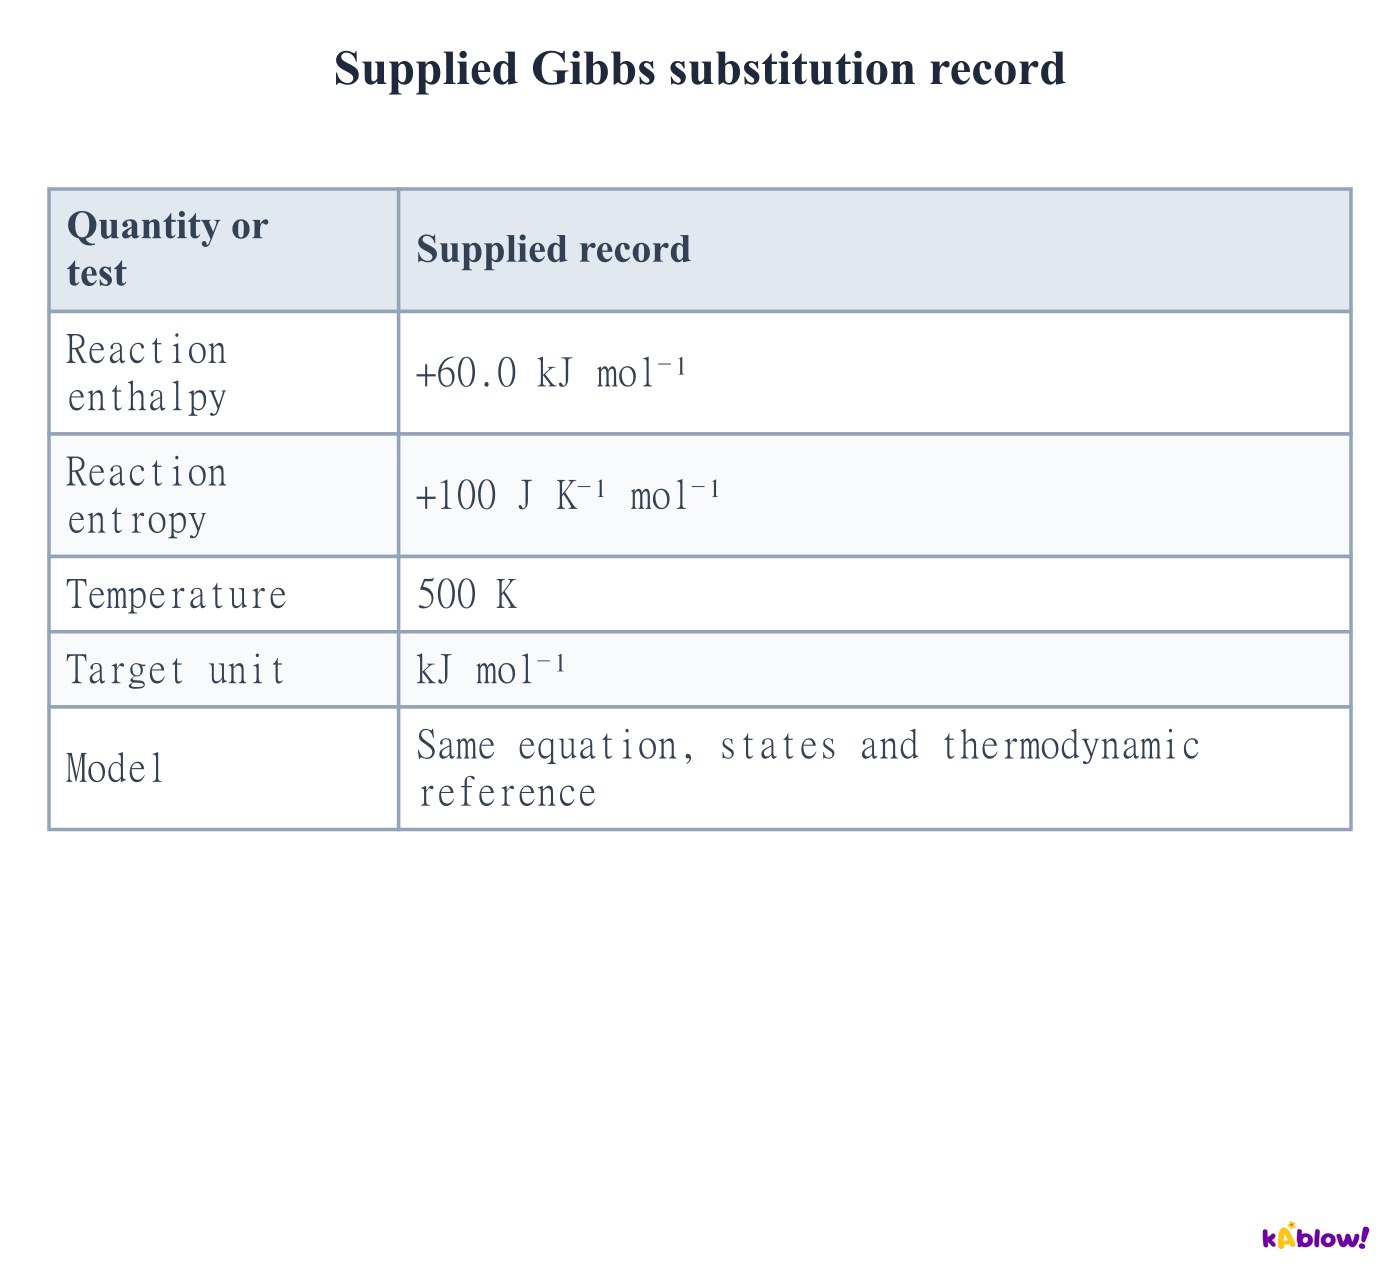
- At a fixed temperature, G=H−TS leads to the reaction relation ΔG=ΔH−TΔS. Temperature must be in kelvin.
- When enthalpy is in kJ mol⁻¹ and entropy in J K⁻¹ mol⁻¹, divide the entropy number by 1000 before combining the terms. Equivalently convert enthalpy to joules and keep everything in joules.
- Entropy can legitimately be expressed in joules or kilojoules per kelvin; the requirement is dimensional consistency. Do not compare an entropy change directly with an enthalpy change without the temperature factor.
Supplied Gibbs substitution record
Calculate a standard Gibbs energy change
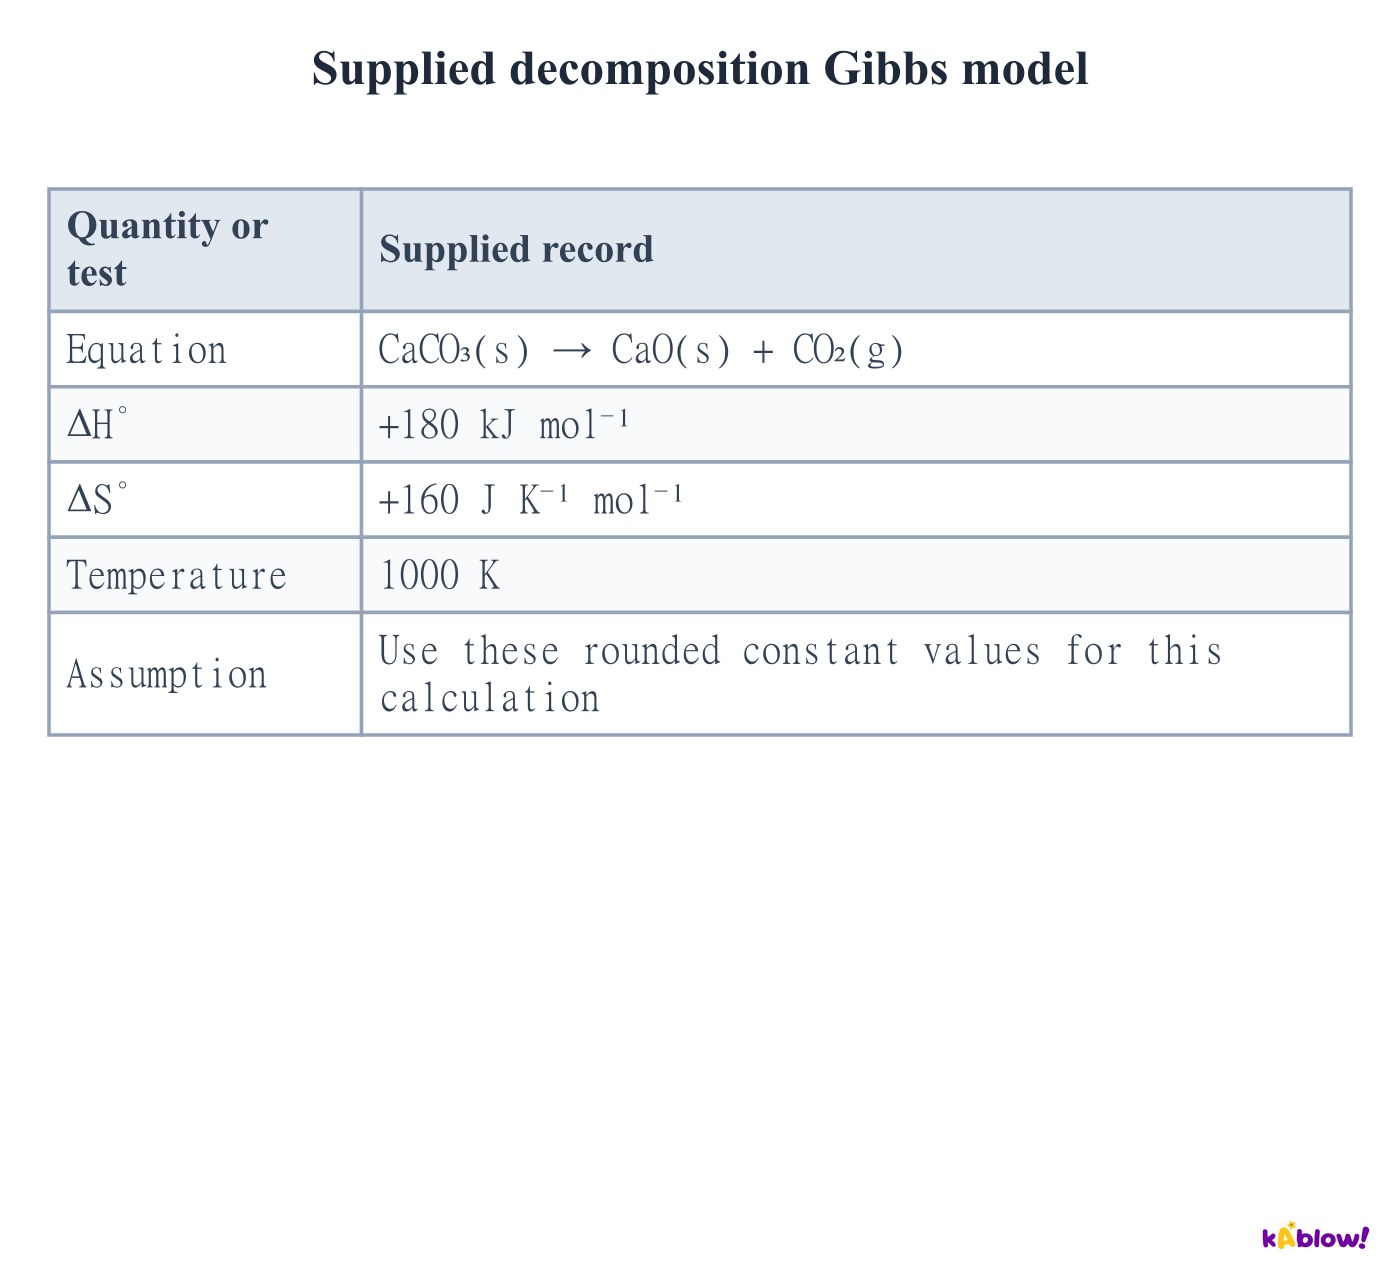
- Use the supplied decomposition model’s stated temperature, phases and per-reaction basis. The rounded values are treated as constant for this calculation.
- At 1000 K, ΔG°=180−1000(160/1000)=+20 kJ mol⁻¹.
- This is a standard-state result. The actual driving force in a particular gas/solid mixture can also depend on composition and partial pressure, so a positive ΔG° is not a claim that every possible mixture cannot react forward.
Supplied decomposition Gibbs model
Use standard formation free-energy data
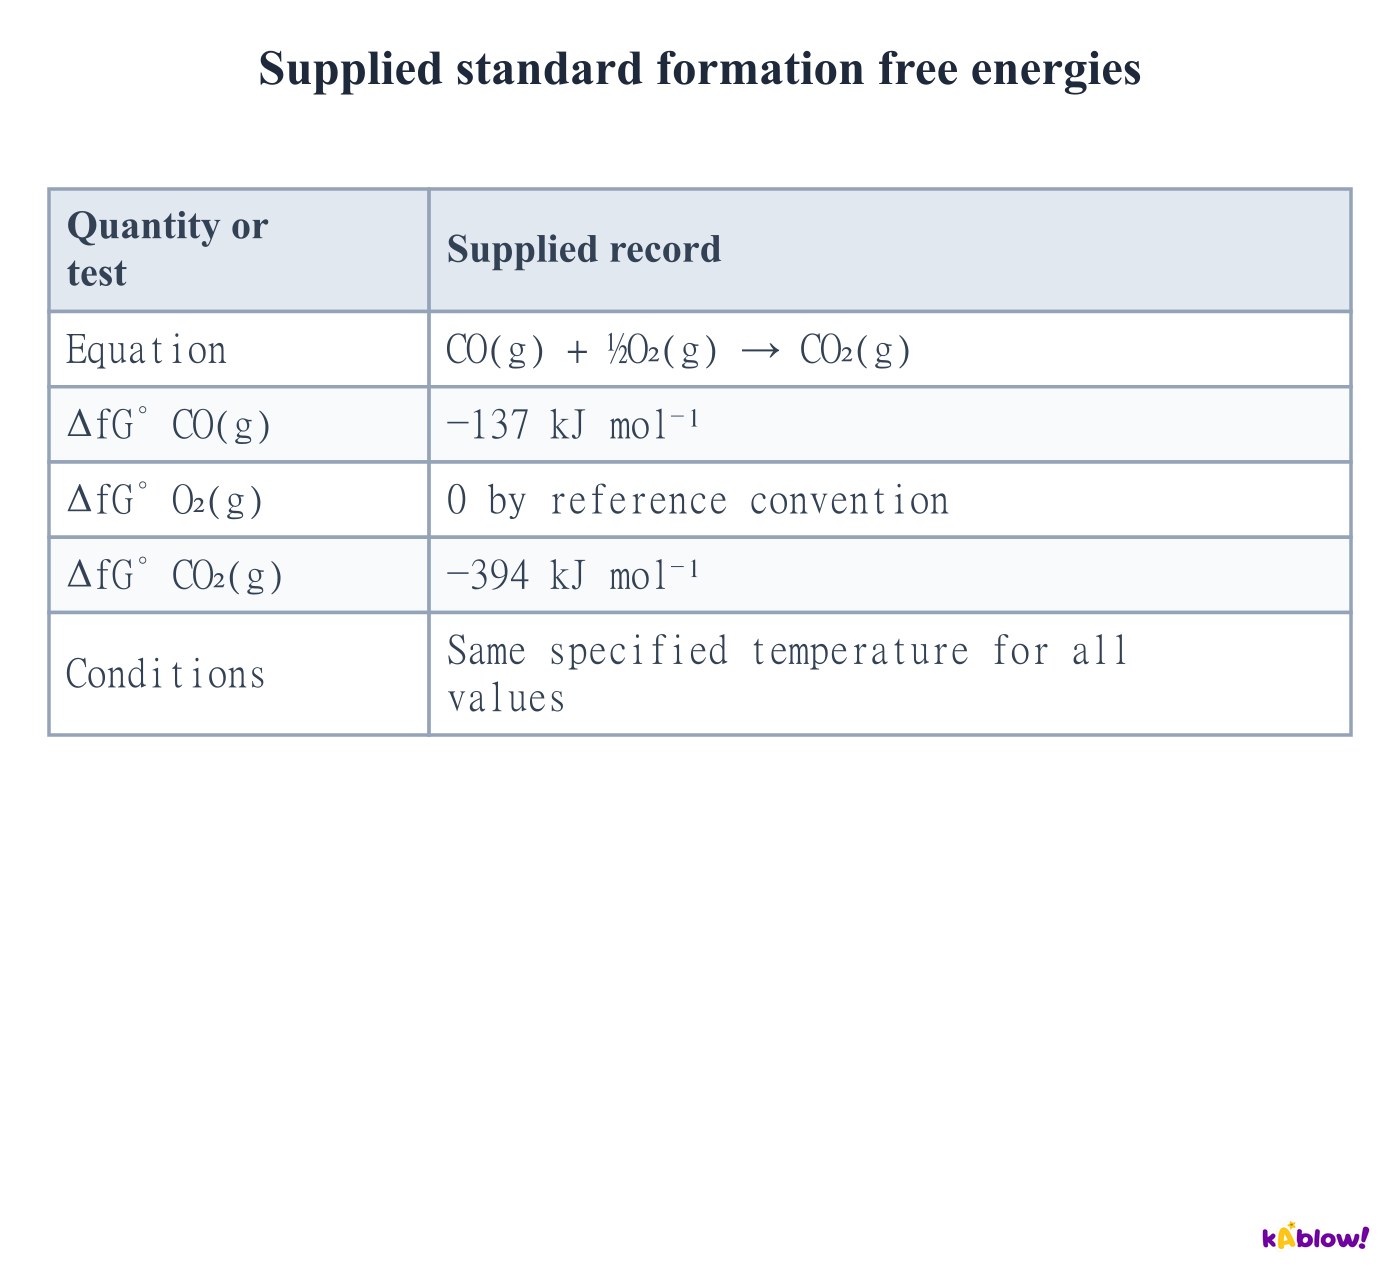
- Calculate a standard reaction Gibbs change by summing coefficient-weighted standard formation free energies of products and subtracting the reactant sum.
- For the supplied CO oxidation, ΔrG°=−394−[−137+½(0)]=−257 kJ mol⁻¹.
- The reference-element formation value is zero by convention. This does not mean that oxygen has zero absolute Gibbs energy or zero standard molar entropy.
Supplied standard formation free energies
Compare the four enthalpy–entropy sign combinations
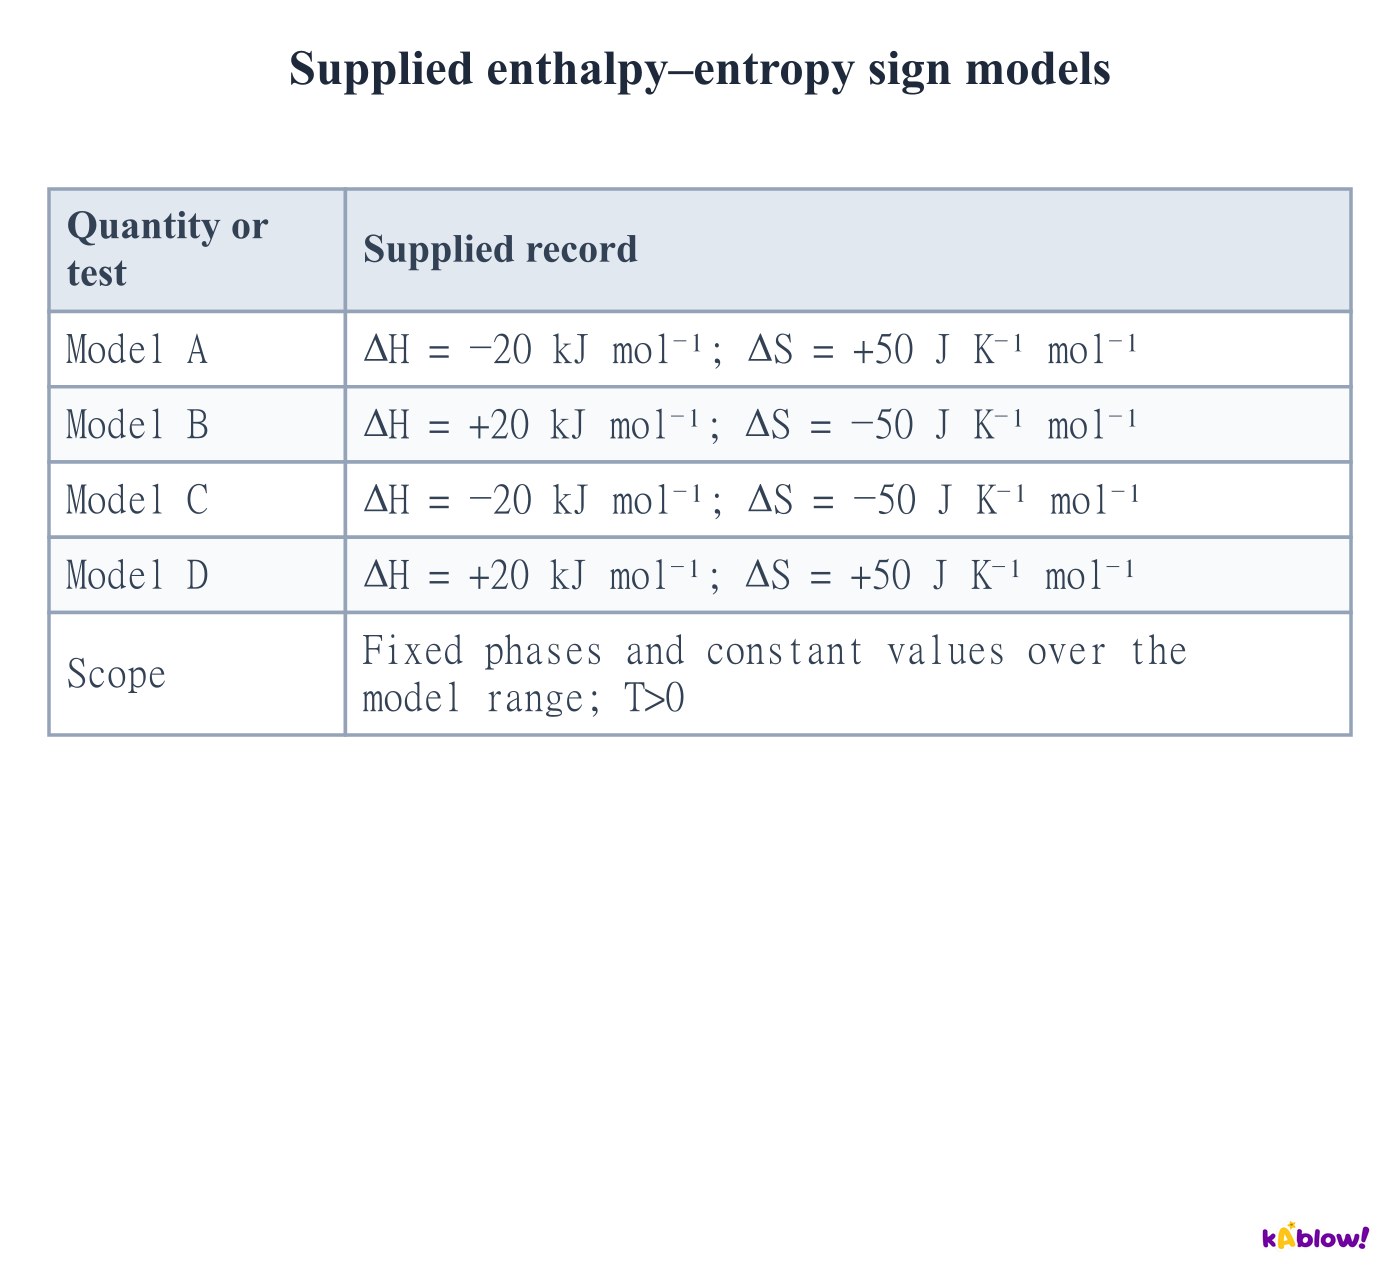
- With fixed phases and constant ΔH and ΔS in the stated model, negative ΔH with positive ΔS gives negative ΔG for every positive temperature in the model range.
- Positive ΔH with negative ΔS gives positive ΔG. When both signs match, a positive threshold may separate the temperature ranges with opposite Gibbs signs.
- These statements are conditional on the model range. Real phase changes and temperature-dependent data can prevent extrapolation to every physical temperature.
Supplied enthalpy–entropy sign models
Find a high-temperature threshold
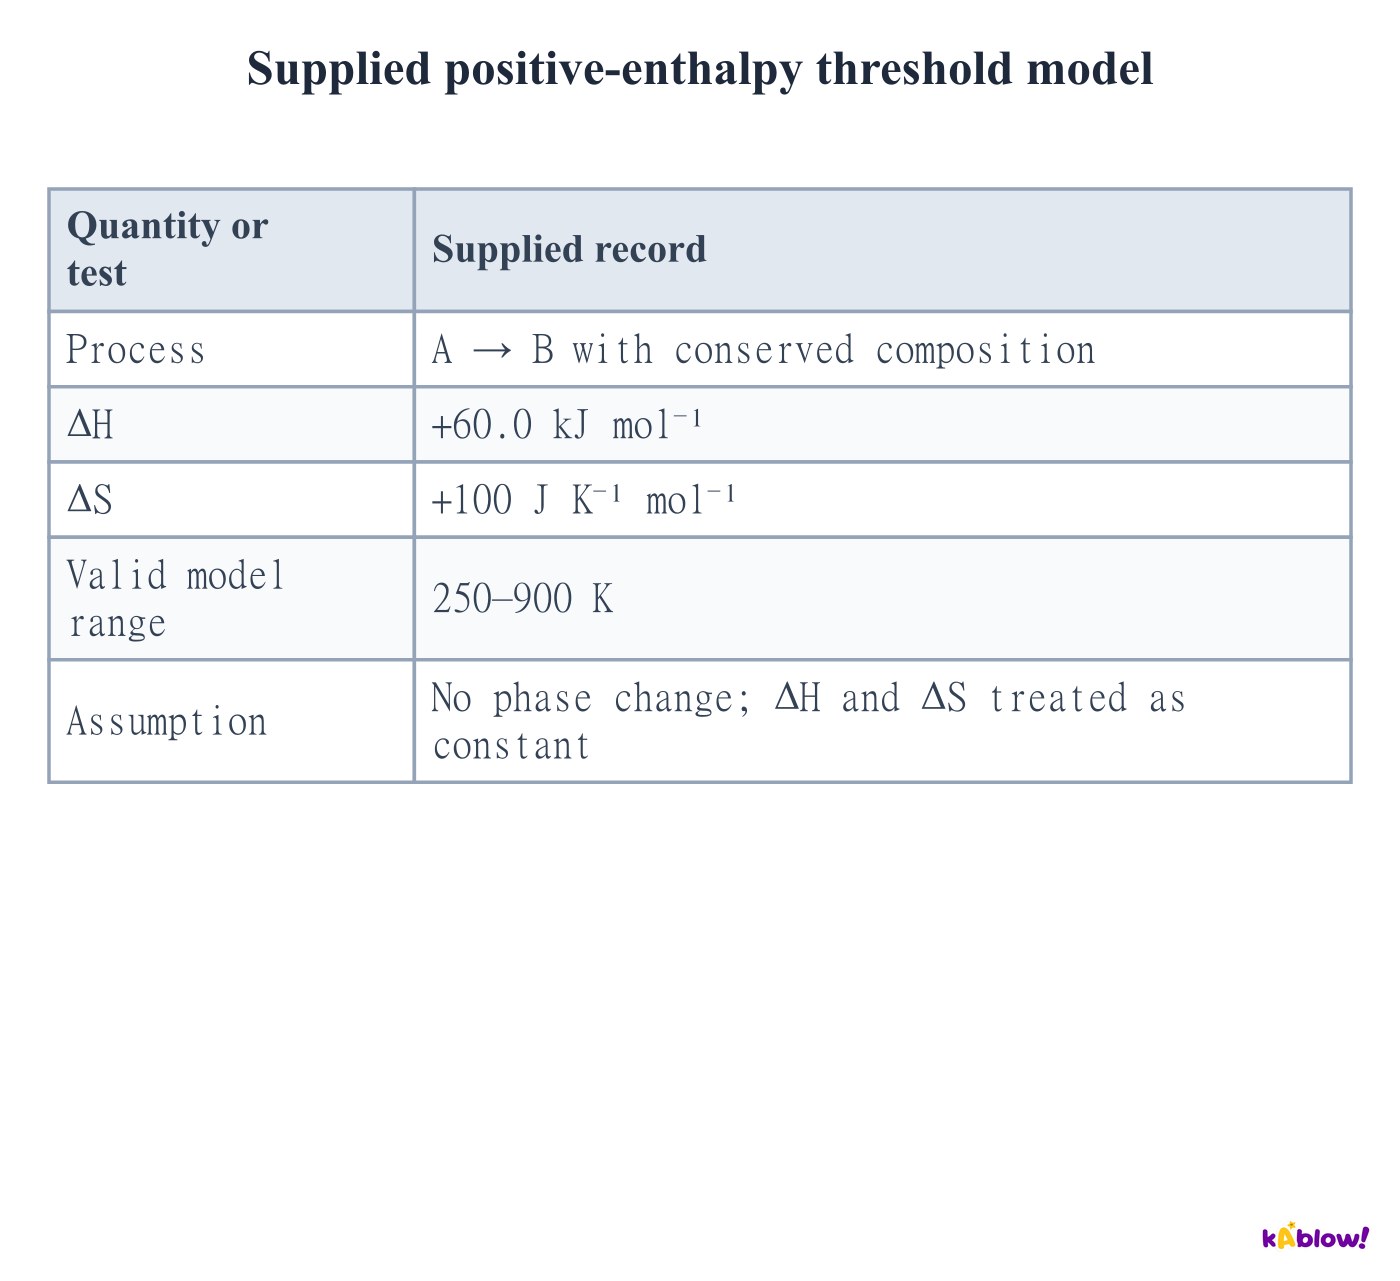
- For the supplied positive-enthalpy, positive-entropy model, set ΔG=0 and use matching energy units: T=60.0/0.100=600 K.
- Above 600 K within the valid range, the entropy term exceeds the enthalpy term and ΔG becomes negative. Below 600 K it is positive.
- At the threshold there is no net thermodynamic driving force. It is a boundary, not evidence that the reaction proceeds rapidly or completely.
Supplied positive-enthalpy threshold model
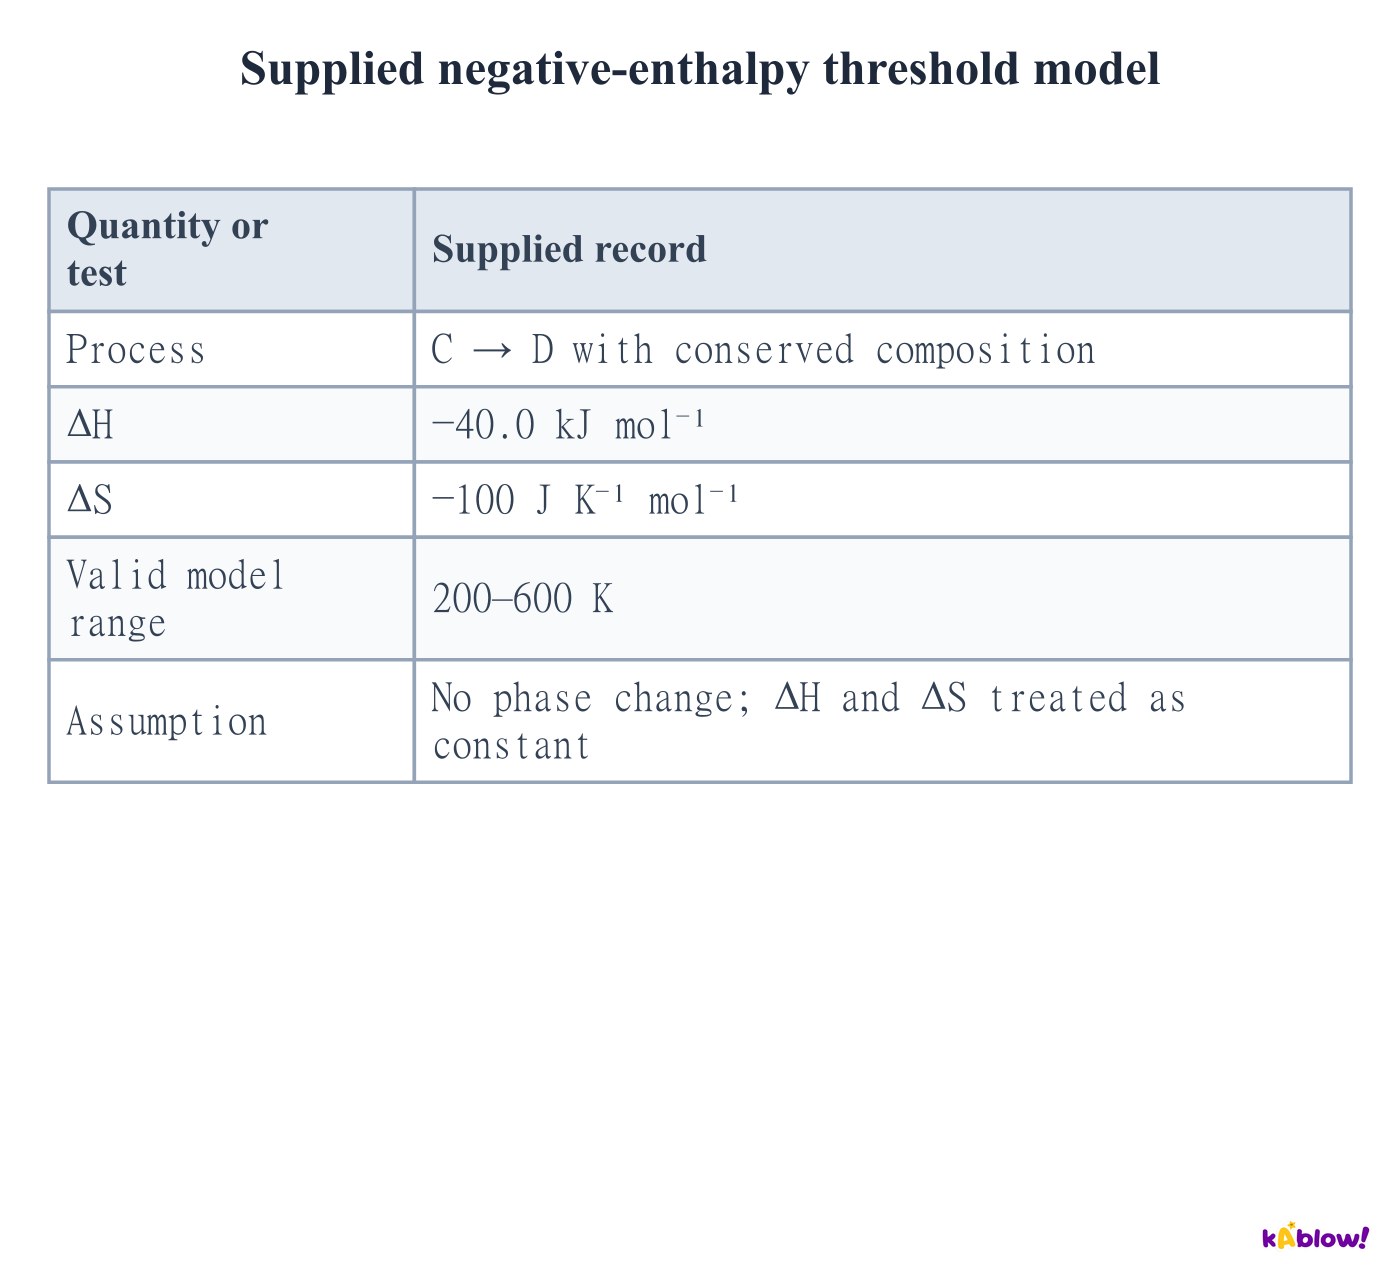
Find a low-temperature threshold
- For negative ΔH and negative ΔS, the−TΔS term is positive. In the supplied model ΔG=−40.0+0.100T.
- The boundary is 400 K. Below 400 K the negative enthalpy dominates and ΔG is negative; above it ΔG is positive within the valid range.
- Keep signs when dividing ΔH byΔS. A negative quotient would not represent a physically meaningful positive-temperature crossing in this simple model.
Supplied negative-enthalpy threshold model
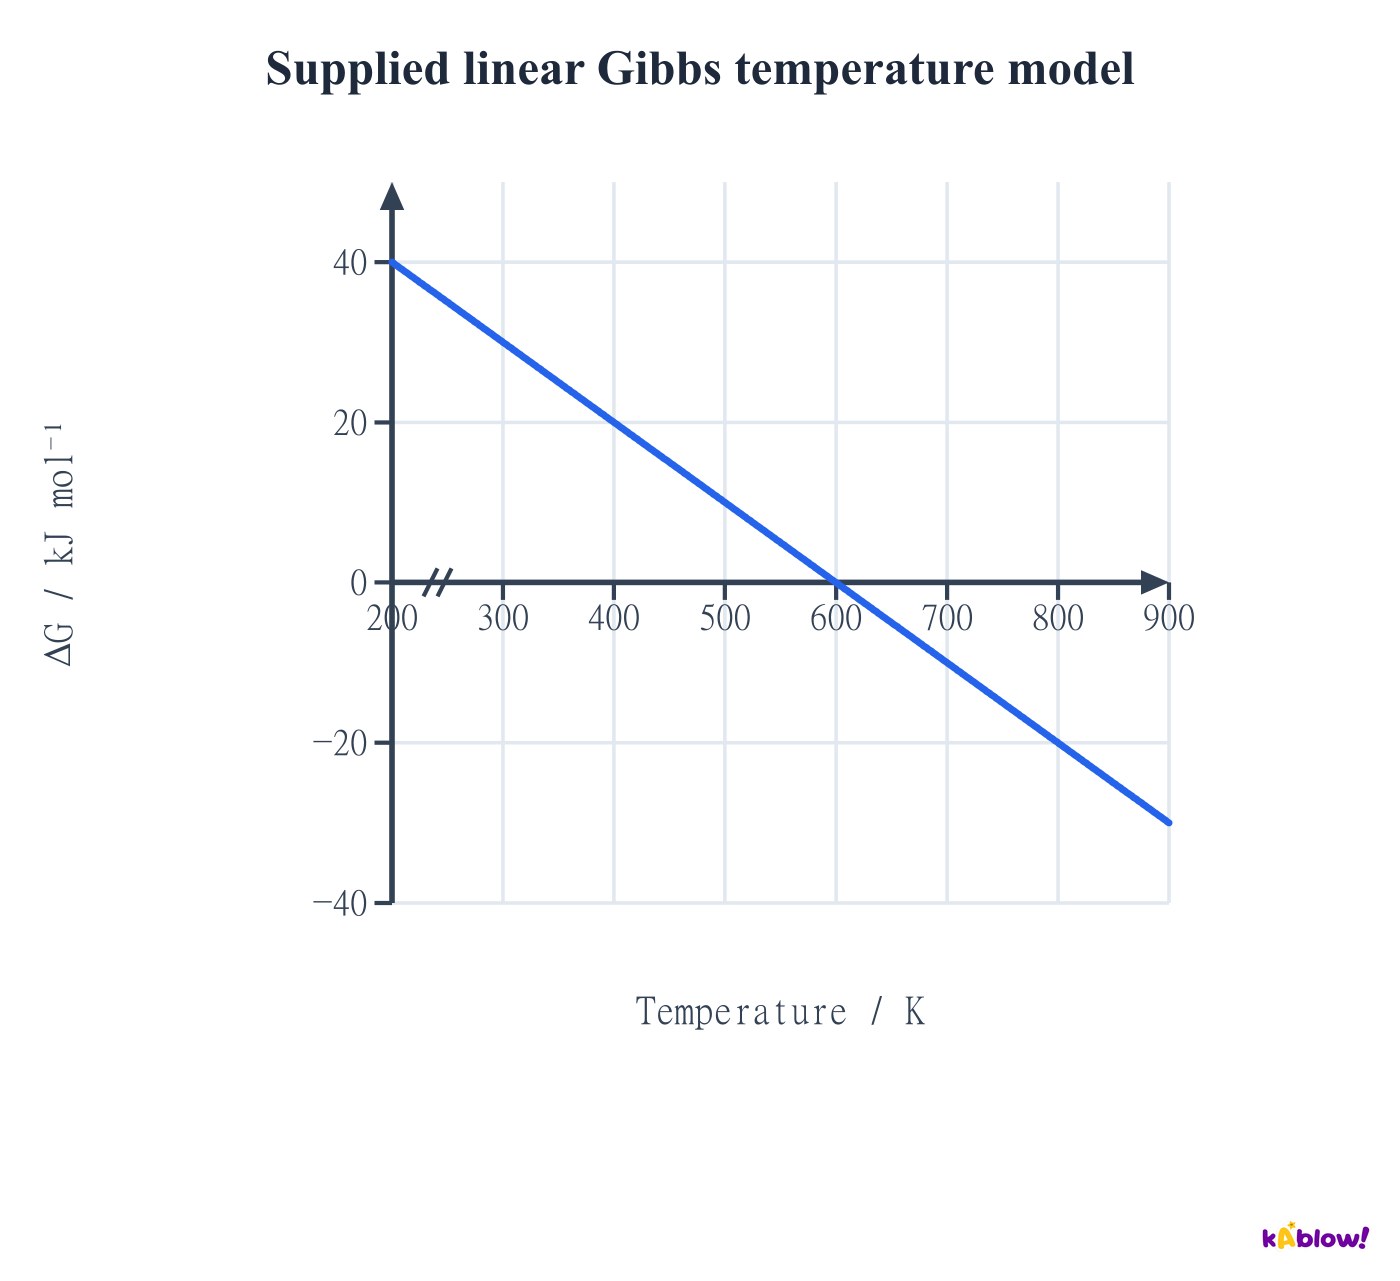
Read entropy and enthalpy from a Gibbs graph
- For constant ΔH and ΔS, the Gibbs equation has straight-line form ΔG=(−ΔS)T+ΔH. Gradient is−ΔS and the extrapolated vertical intercept isΔH.
- The supplied graph falls by 20 kJ mol⁻¹ per 200 K, so its gradient is −0.100 kJ K⁻¹ mol⁻¹ and ΔS=+100 J K⁻¹ mol⁻¹.
- The plotted range starts at 200 K. A vertical intercept inferred at 0 K is an algebraic extrapolation of the model, not a measured value proving the same phases exist there.
Supplied linear Gibbs temperature model
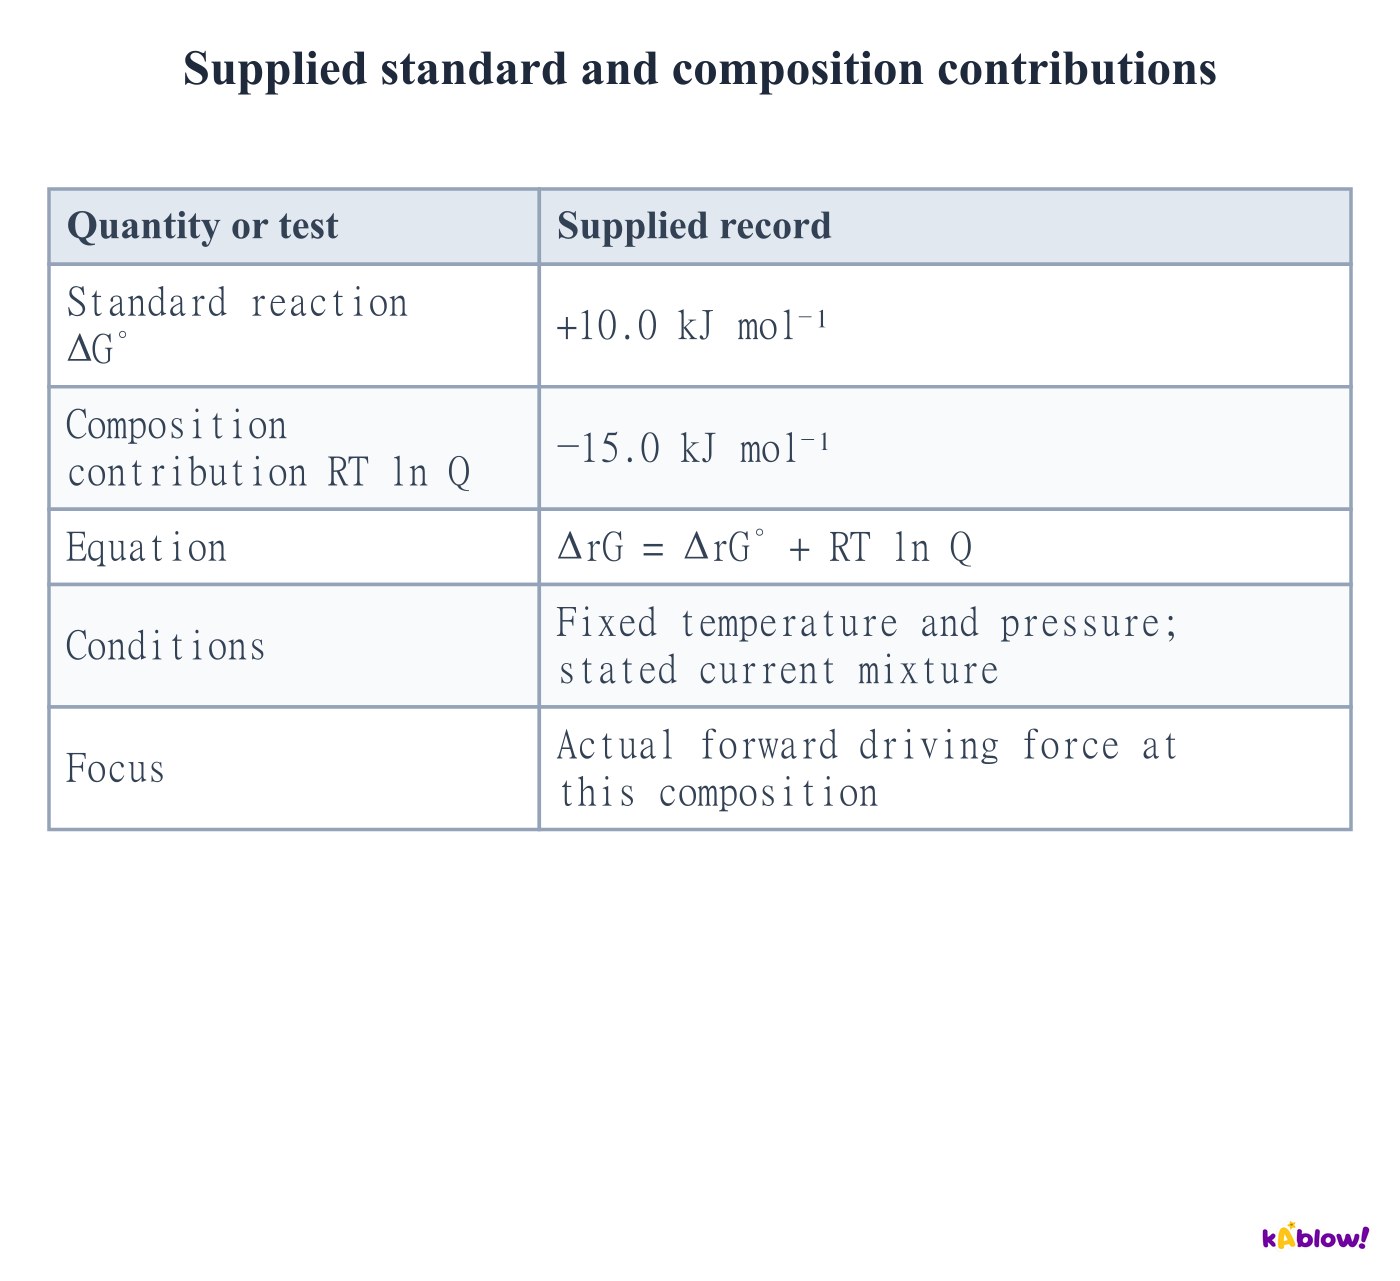
Distinguish standard and actual reaction driving forces
- As an extension linking equilibrium and thermodynamics, actual reaction Gibbs energy depends on composition: ΔrG=ΔrG°+RT lnQ with a dimensionless activity quotient.
- The supplied record gives a positive standard contribution and a larger negative composition contribution, leaving actual ΔrG=−5.0 kJ mol⁻¹.
- Composition or pressure can therefore change the actual forward driving force without a catalyst changing ΔrG°. This distinction resolves why a standard-state graph alone does not determine every industrial mixture’s behaviour.
Supplied standard and composition contributions
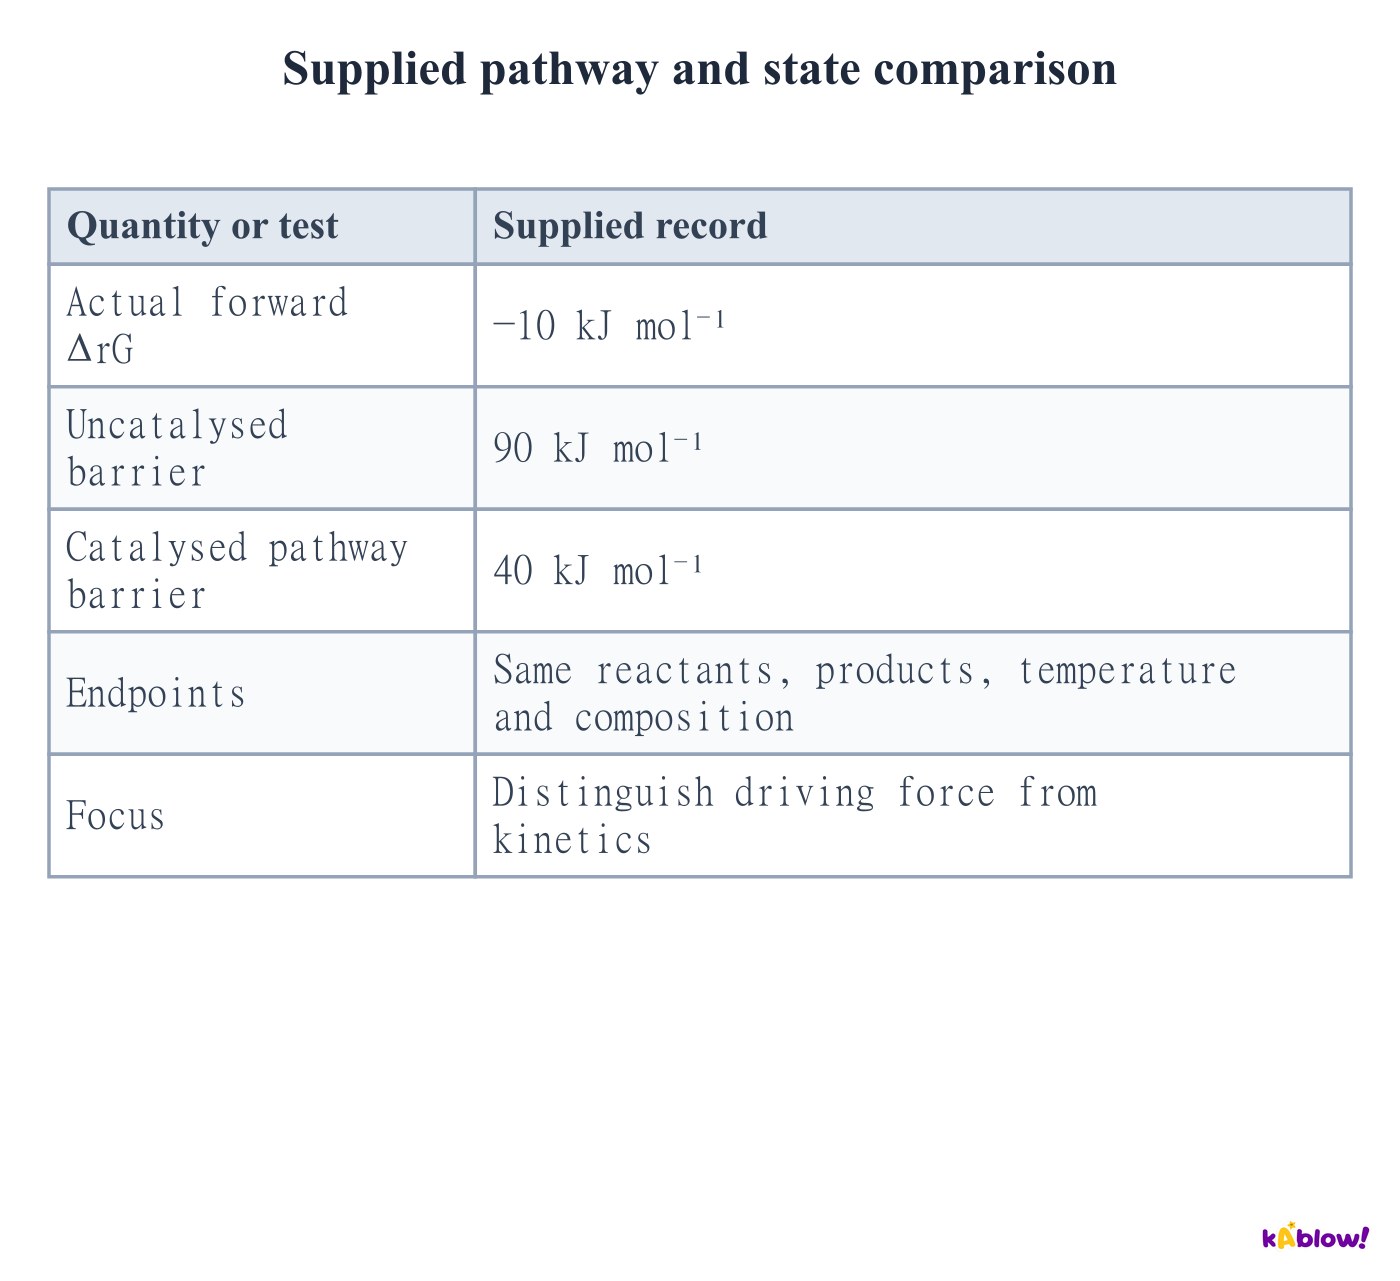
Separate thermodynamic feasibility from reaction rate
- Negative actual ΔrG indicates a thermodynamically favoured forward direction at the stated composition and conditions. It does not specify a fast rate.
- The supplied catalyst lowers the activation barrier while retaining the same endpoints, temperature and composition. The reaction Gibbs energy remains−10 kJ mol⁻¹.
- A catalyst can speed approach to equilibrium but changes neither the equilibrium constant nor the reaction’s state-function difference. At equilibrium the actual reaction Gibbs energy is zero; the standard value need not be zero.
Supplied pathway and state comparison
स्लाइड्स
Sign up free to view the lesson slides
Step through every slide for this topic — plus flashcards and revision notes — with a free account.
प्रैक्टिस सवाल
फ्री प्रीव्यू — 60 में से 8 सवाल। सभी देखने के लिए साइन अप करें।
1.Which supplied equation represents standard formation of one mole of NaCl from the stated reference elements?
Medium- AA
- BB
- CC
- DAll three
2.What atomisation enthalpy follows for chlorine from the supplied bond datum?
Medium- A+60.5 kJ mol⁻¹
- B+121 kJ mol⁻¹
- C+242 kJ mol⁻¹
- D+484 kJ mol⁻¹
3.Which supplied steps are required to reach Mg²⁺ from Mg(g)?
Medium- AA only
- BB only
- CA and B in sequence
- DNeither
4.What signed total belongs to the supplied two-electron oxygen change?
Medium- A−939 kJ mol⁻¹
- B−657 kJ mol⁻¹
- C+657 kJ mol⁻¹
- D+939 kJ mol⁻¹
5.What enthalpy belongs to supplied reverse process B?
Medium- A−1574 kJ mol⁻¹
- B−787 kJ mol⁻¹
- C+787 kJ mol⁻¹
- D0
6.What net enthalpy change follows from the atoms node to the gaseous-ions node through the two supplied steps?
Medium- A−845 kJ mol⁻¹
- B−147 kJ mol⁻¹
- C+147 kJ mol⁻¹
- D+845 kJ mol⁻¹
7.What lattice-formation enthalpy follows from the supplied NaCl data?
Medium- A−787 kJ mol⁻¹
- B−376 kJ mol⁻¹
- C+376 kJ mol⁻¹
- D+787 kJ mol⁻¹
8.Which supplied contribution must be included when forming O²⁻ from an oxygen atom?
Medium- AOnly EA1
- BOnly EA2
- CBoth EA1 andEA2
- DNeither affinity
Unlock all 60 questions, flashcards & more
इस टॉपिक के हर सवाल, स्लाइड्स, फ्लैशकार्ड और रिवीज़न नोट्स देखने के लिए फ्री अकाउंट बनाएं।