Real Life Graphs
Apréndelo jugando
Responde estas preguntas para ganar energía, luego pesca y explora. Sin cuenta.
Apuntes de la lección
Conversion Graphs
- A conversion graph is a straight-line graph relating two quantities (e.g., currency, temperature).
- To convert from one quantity to the other, read across from the given value to the graph line, then read down/up to the other axis.
- The gradient of a conversion graph represents the rate of change (e.g., cost per kilometre).
- If the graph starts at the origin, you can use proportion to find values not on the axes.
- If the graph does not start at the origin, the y-intercept often represents a fixed cost (e.g., callout fee).
- Always check the scales on both axes carefully before reading values.
Conversion graph: mass to cost
Distance-Time Graphs
- A distance-time graph shows distance travelled (vertical axis) against time (horizontal axis).
- The gradient of the graph equals the speed (speed = distance ÷ time).
- A steeper line means a faster speed; a horizontal line means the object is stationary (rest).
- A line with positive gradient indicates moving away from the start; negative gradient indicates moving back towards the start.
- The overall average speed for a journey = total distance travelled ÷ total time (including rests).
- To find the distance at a given time, draw a vertical line to the graph then horizontal to the distance axis.
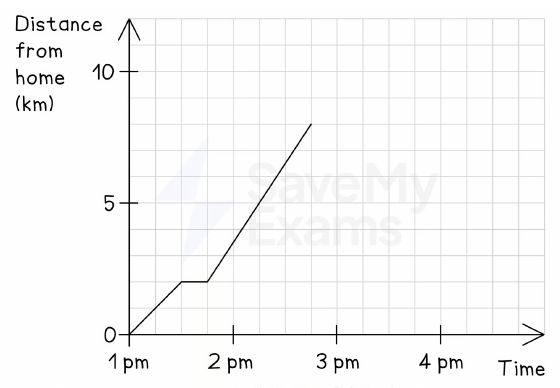
Mary's journey to her grandfather's house
Speed-Time Graphs
- A speed-time graph shows speed (vertical axis) against time (horizontal axis).
- A horizontal line means constant speed (if speed = 0, the object is at rest).
- A line with positive gradient means acceleration (speeding up); negative gradient means deceleration (slowing down).
- The area under a speed-time graph represents the distance travelled (not required at Core level but useful).
- Always check the vertical axis label to distinguish speed-time from distance-time graphs.
Speed–time graph
Interpreting Travel Graphs
- A travel graph is a distance-time graph showing a journey with possible stops.
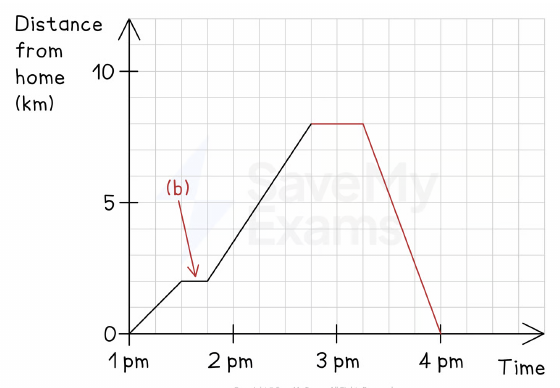
- A horizontal section indicates a stop (rest) – read the time duration from the time axis.
- To find the distance of a stop from home, read the distance at the horizontal section.
- To find arrival time, read the time at the final distance point.
- To complete a travel graph, add horizontal lines for stops and straight lines for travel at constant speed.
Mary's complete return journey
Calculating Speed from Graphs
- Speed = gradient = (change in distance) ÷ (change in time).
- Use a straight section of the graph to calculate speed (rise over run).
- If the graph has multiple sections, calculate speed separately for each.
- For a return journey, the gradient is negative but the speed is the absolute value of the gradient.
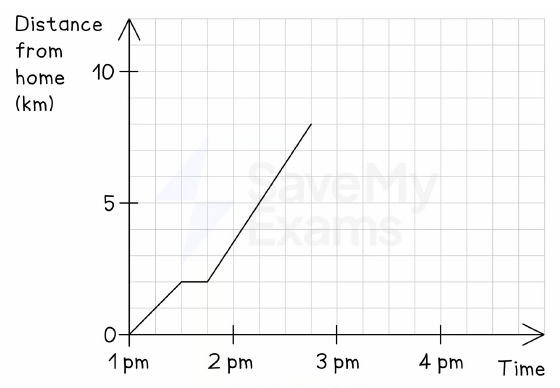
- Example: A line from (1:45, 2 km) to (2:45, 8 km) has gradient (8-2)/(1) = 6 km/h.
Mary's journey to her grandfather's house
Using Conversion Graphs with Fixed Charges
- Some conversion graphs do not pass through the origin – the y-intercept is a fixed charge (e.g., callout fee).
- To find the fixed charge, read the value on the y-axis when x = 0.
- The gradient then represents the cost per unit (e.g., per hour or per km).
- To find the equation of the line: c = gradient × d + fixed charge.
- Example: A plumber charges £45 callout plus £60 per hour → c = 60t + 45.
Plumber's charge graph
Comparing Two Linear Graphs
- When comparing two services (e.g., taxis), plot both lines on the same axes.
- The point of intersection shows where the costs are equal.
- For distances less than the intersection, the cheaper service is the one with the lower y-intercept.
- For distances greater than the intersection, the cheaper service is the one with the lower gradient.
- Always state which is cheaper for a given distance using the graph.
Comparing two taxi services
Completing Travel Graphs
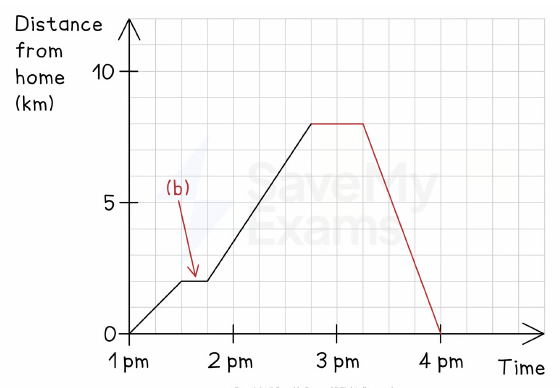
- To complete a travel graph, first add any stops as horizontal lines for the correct duration.
- For travel at constant speed, draw a straight line from the end of the stop to the destination at the correct time.
- The gradient of the return line should match the speed given (use rise/run to check).
- Ensure the graph is continuous and labelled with time and distance as required.
Mary's complete return journey
Diapositivas
Sign up free to view the lesson slides
Step through every slide for this topic — plus flashcards and revision notes — with a free account.
Preguntas de práctica
Vista previa gratis — 8 de 56 preguntas. Regístrate para verlas todas.
1.What does the gradient of a distance-time graph represent?
Easy- ASpeed
- BDistance
- CTime
- DAcceleration
2.On a distance-time graph, a horizontal line indicates that the object is:
Easy- AStationary
- BMoving at constant speed
- CAccelerating
- DDecelerating
3.What does the gradient of a conversion graph represent?
Easy- ARate of change
- BFixed cost
- CTotal cost
- DInitial value
4.A conversion graph shows the cost of a taxi journey. The y-intercept is £5. What does this represent?
Easy- AFixed charge
- BCost per mile
- CTotal cost for 1 mile
- DDistance travelled
5.In a distance-time graph, a steeper line means:
Easy- AFaster speed
- BSlower speed
- CLonger time
- DShorter distance
6.A car travels 120 km in 2 hours. What is its average speed in km/h?
Easy- A60 km/h
- B240 km/h
- C30 km/h
- D120 km/h
7.A journey consists of 3 parts: 2 hours at 50 km/h, then 1 hour rest, then 1 hour at 30 km/h. What is the total distance travelled?
Medium- A130 km
- B160 km
- C100 km
- D80 km
8.On a speed-time graph, a horizontal line at 20 m/s for 10 seconds means the object travels:
Easy- A200 m
- B20 m
- C2 m
- D0.5 m
Unlock all 56 questions, flashcards & more
Crea una cuenta gratis para ver todas las preguntas, las diapositivas, las tarjetas y los apuntes de repaso de este tema.