Real Life Graphs
Apprends en jouant
Réponds à ces questions pour gagner de l'énergie, puis pêche et explore. Sans compte.
Notes de leçon
Conversion Graphs
- A conversion graph is a straight-line graph used to convert between two quantities (e.g., °C to °F, currency, litres to gallons).
- The gradient represents the rate of change (e.g., cost per mile on a taxi fare graph).
- To convert a value, draw a vertical/horizontal line to the graph, then read off the other axis.
- If the graph starts at the origin, you can use proportion to find values not on the axes.
- If the graph does not start at the origin (e.g., fixed callout fee), the y-intercept represents the fixed cost.
- Always double-check the scales on both axes before reading values.
Conversion graph: mass to cost
Distance-Time Graphs
- Distance-time graphs show distance on the vertical axis and time on the horizontal axis.
- The gradient of the graph equals the speed (speed = distance/time).
- A steeper line means faster speed; a horizontal line means the object is stationary.
- A line with positive gradient indicates moving away from the start; negative gradient indicates moving back towards the start.
- Overall average speed = total distance travelled ÷ total time (including rests).
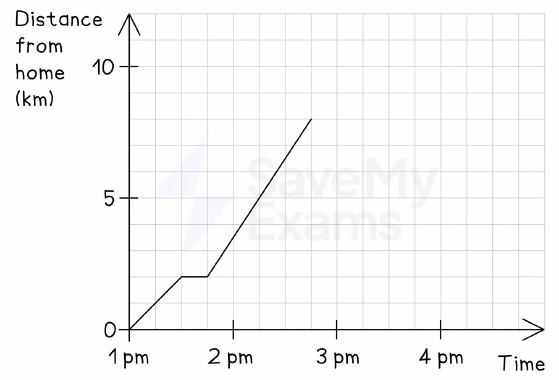
- To complete a journey graph, add a horizontal line for rests and a straight line (with appropriate gradient) for return trips.
Mary's journey to her grandfather's house
Speed-Time Graphs
- Speed-time graphs show speed on the vertical axis and time on the horizontal axis.
- The gradient equals acceleration (acceleration = speed/time). Positive gradient = speeding up; negative gradient = deceleration.
- A horizontal line indicates constant speed (if speed = 0, the object is at rest).
- Distance travelled is the area under the graph – split into rectangles and triangles to calculate.
- For a curved graph, draw a tangent at a point to find instantaneous acceleration.
- Always check the vertical axis to distinguish speed-time from distance-time graphs.
Speed–time graph
Rates-of-Change Graphs
- Rates-of-change graphs show how one variable changes with respect to another (often time).
- The gradient of the graph gives the rate of change (e.g., litres per kilometre, cm³ per second).
- A constant gradient means a constant rate of change; a horizontal line means zero rate of change.
- For a curve, draw a tangent to estimate the rate of change at a specific point.
- The units of the gradient are the y-axis units divided by the x-axis units.
- In filling containers, the shape of the depth-time graph reflects the container's width: narrow parts give steeper gradients (faster depth increase).
Rate of change from a curve
Diapos
Sign up free to view the lesson slides
Step through every slide for this topic — plus flashcards and revision notes — with a free account.
Questions d'entraînement
Aperçu gratuit — 8 sur 37 questions. Inscris-toi pour toutes les voir.
1.On a conversion graph, the gradient represents:
Easy- Athe rate of change between the two quantities
- Bthe total amount of the first quantity
- Cthe starting value of the second quantity
- Dthe difference between the two quantities
2.In a speed-time graph, a horizontal line represents:
Easy- Aconstant speed
- Bacceleration
- Cdeceleration
- Drest
3.The distance travelled by an object is equal to the area under which type of graph?
Easy- Aspeed-time graph
- Bdistance-time graph
- Cacceleration-time graph
- Dconversion graph
4.On a distance-time graph, a horizontal line indicates:
Easy- Athe object is stationary
- Bthe object is moving at constant speed
- Cthe object is accelerating
- Dthe object has returned to the start
5.The gradient of a distance-time graph gives the:
Easy- Aspeed
- Bacceleration
- Cdistance
- Dtime
6.A car travels at 20 m/s for 15 seconds, then decelerates at 2.5 m/s² until it stops. Find the total distance travelled.
Medium- A380 m
- B300 m
- C450 m
- D500 m
7.The speed-time graph shows a car accelerating from rest to 20 m/s in 10 seconds, then travelling at constant speed for 20 seconds, then decelerating to rest in 10 seconds. What is the total distance travelled?
Medium- A600 m
- B500 m
- C700 m
- D400 m
8.Using a conversion graph, if 10 kg costs $6, what is the cost of 35 kg?
Medium- A$21
- B$18
- C$24
- D$30
Unlock all 37 questions & more
Crée un compte gratuit pour voir toutes les questions, les diapos, les cartes mémo et les notes de révision de ce thème.