Measuring Enthalpy Change
Belajar sambil bermain
Jawab soal-soal ini untuk dapat energi, lalu memancing dan menjelajah. Tanpa akun.
Catatan pelajaran
Heat vs Temperature
- Temperature is a measure of the average kinetic energy of the particles in a substance.
- Heat is a measure of the total energy content of a substance.
- A beaker of boiling water has a much higher heat content than a single drop at the same temperature, so it can cause a more severe burn.
- Particles have kinetic energy because they are moving; the faster they move, the higher the temperature.
- Energy is the ability to do work, and heat is only one type of energy.
Systems and Conservation of Energy
- The system is the reacting substances inside the reaction vessel; the surroundings are everything outside.
- In an open system, both matter and energy can move in and out; most chemical reactions occur in open systems.
- In a closed system, energy can move in and out but matter cannot.
- In an isolated system, neither matter nor energy can be exchanged with the surroundings; these are very rare.
- The Law of Conservation of Energy states that energy cannot be created or destroyed, only transferred.
Exothermic and Endothermic Reactions
- Enthalpy (H) is the total chemical energy inside a substance; an enthalpy change is represented by ΔH.
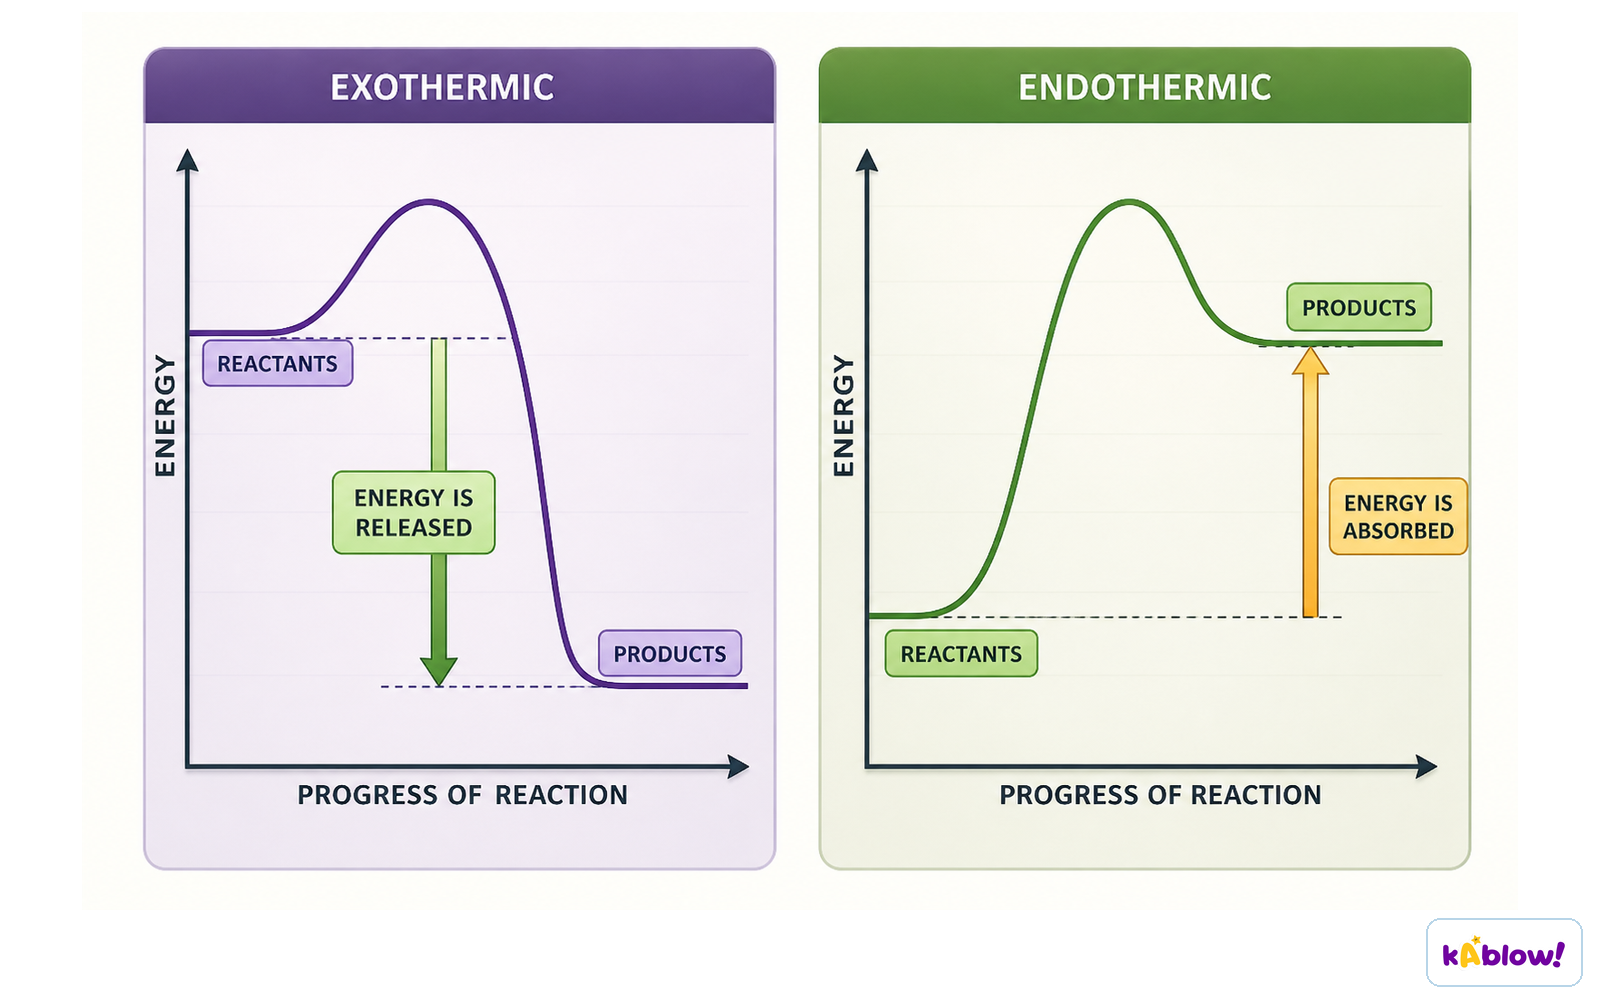
- In an exothermic reaction, products have less enthalpy than reactants; heat is given off to the surroundings, so the surroundings' temperature increases and ΔH is negative.
- In an endothermic reaction, products have more enthalpy than reactants; heat is absorbed from the surroundings, so the surroundings' temperature decreases and ΔH is positive.
- Exothermic reactions are thermodynamically possible because reactants have higher enthalpy than products, but they may be too slow (kinetically controlled).
- In simple terms, exothermic reactions release energy to the surroundings, while endothermic reactions take in energy, making the surroundings feel colder.
Exothermic and endothermic reactions
Energy Profiles
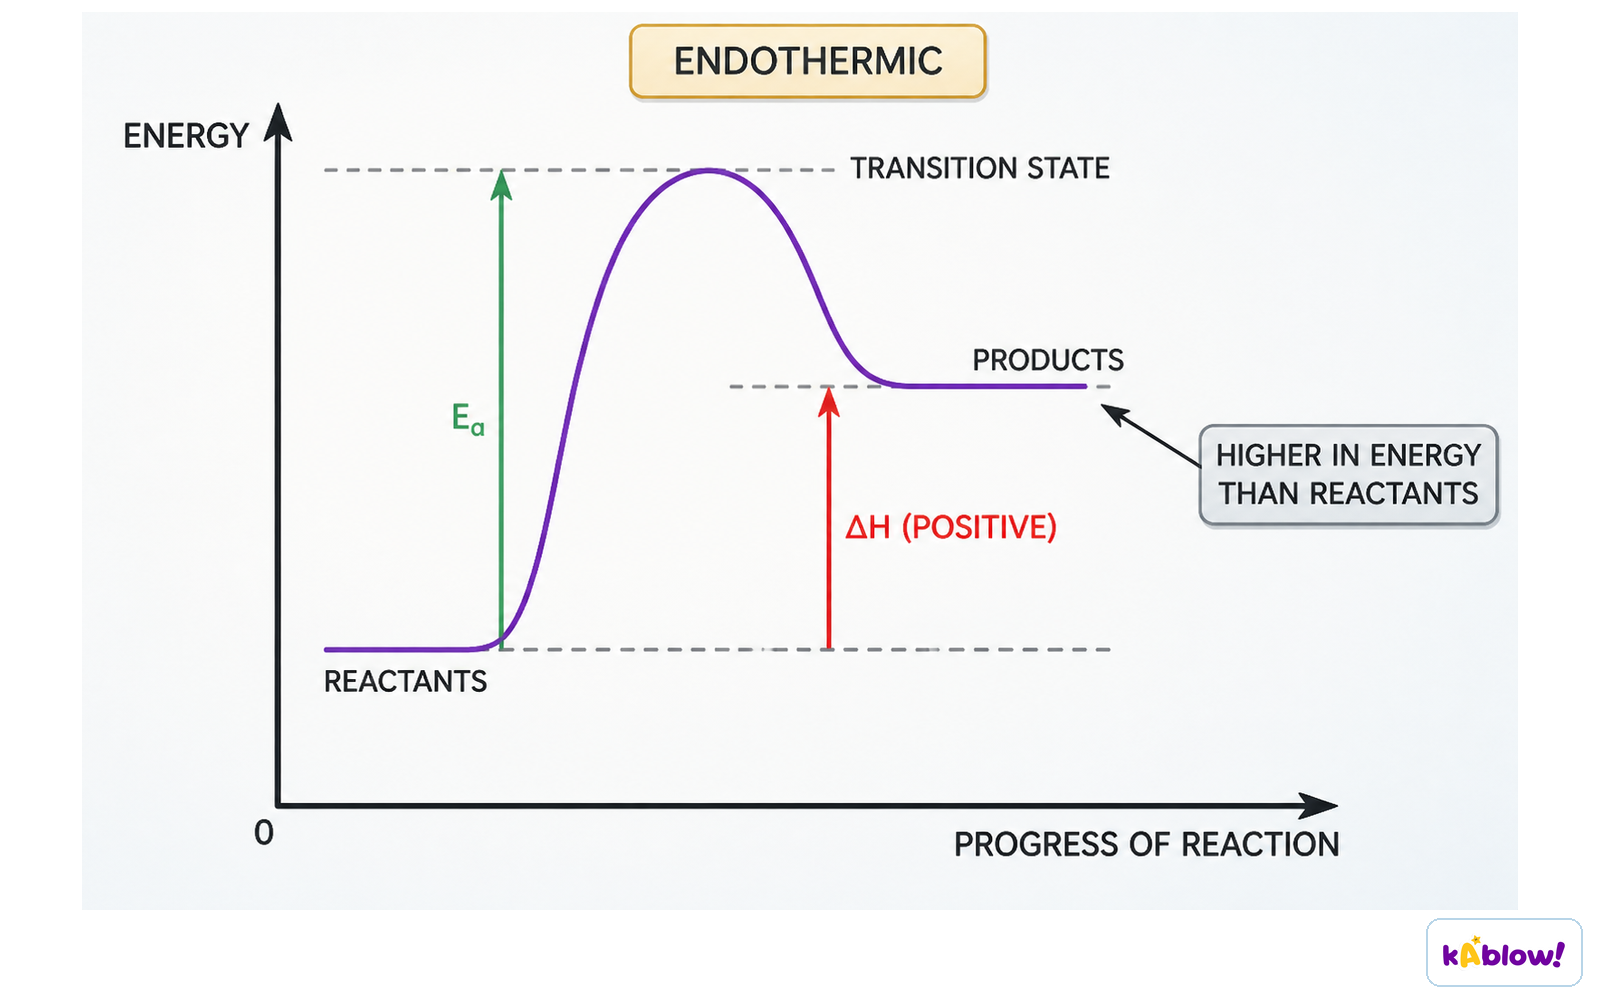
- An energy profile shows how the energy of a system changes during a reaction, including reactants, products, and the transition state.
- The transition state is the highest energy point where bonds are partially broken and formed; it is unstable and cannot be isolated.
- Activation energy (Ea) is the minimum energy needed for reactant molecules to collide successfully and start the reaction.
- In an exothermic reaction, reactants are higher in energy than products and closer to the transition state, so Ea is lower than for an endothermic reaction.
- In an endothermic reaction, reactants are lower in energy than products and further from the transition state, so Ea is higher.
- The activation energy is the energy difference from reactants to the transition state; the enthalpy change is the energy difference from reactants to products.
Reaction pathway diagrams
Standard Enthalpy Changes
- Standard conditions are: pressure of 100 kPa, concentration of 1 mol dm⁻³ for solutions, and substances in their standard states; a temperature of 298.15 K is usually specified.
- The symbol ⦵ indicates standard conditions, e.g. ΔH⦵.
- Standard enthalpy of reaction (ΔHr⦵): enthalpy change when reactants in the stoichiometric equation react to give products under standard conditions; can be exothermic or endothermic.
- Standard enthalpy of formation (ΔHf⦵): enthalpy change when one mole of a compound is formed from its elements under standard conditions; can be exothermic or endothermic.
- Standard enthalpy of combustion (ΔHc⦵): enthalpy change when one mole of a substance is burnt in excess oxygen under standard conditions; always exothermic.
- Standard enthalpy of neutralisation (ΔHneut⦵): enthalpy change when one mole of water is formed by reacting an acid and an alkali under standard conditions; always exothermic.
Calorimetry: Measuring Enthalpy Changes
- Calorimetry is a technique used to measure enthalpy changes of chemical reactions.
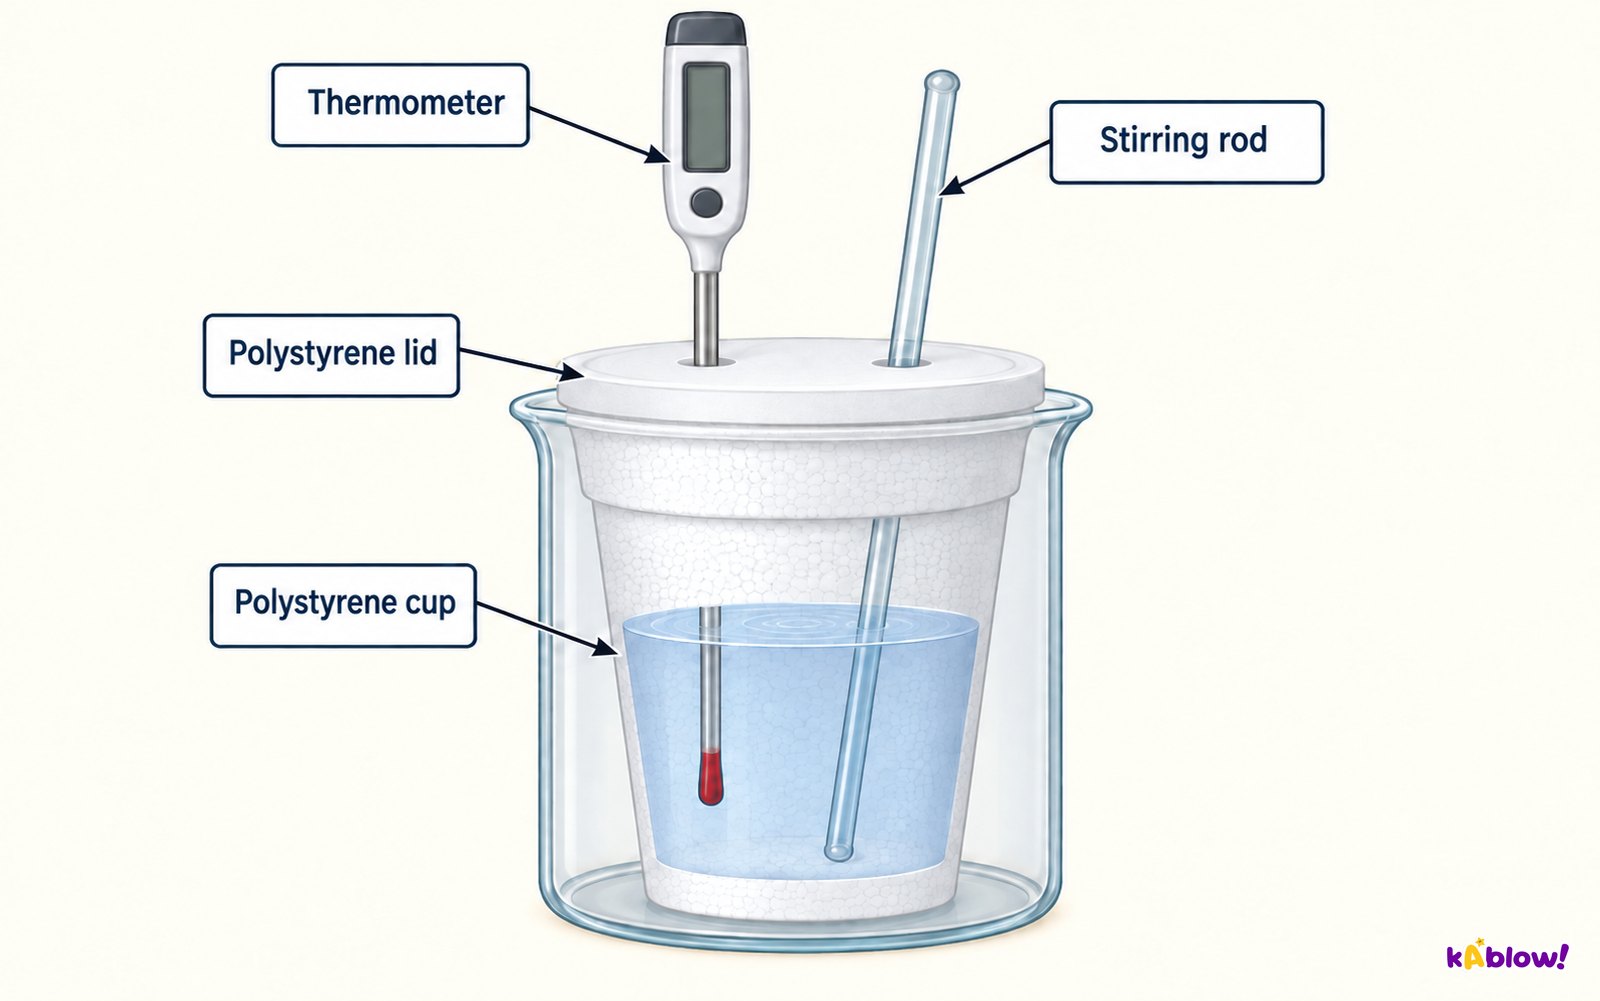
- A simple calorimeter can be made from a polystyrene cup, a vacuum flask, or a metal can.
- The energy transferred as heat is calculated using q = m × c × ΔT, where q is heat transferred (J), m is mass of water (g), c is specific heat capacity (J g⁻¹ K⁻¹), and ΔT is temperature change (K).
- The specific heat capacity of water is 4.18 J g⁻¹ K⁻¹.
- For calculations, assume the specific heat capacity and density of the solution are the same as pure water (density = 1 g cm⁻³), ignore the container's heat capacity, assume complete reaction, and assume negligible heat losses.
- There is no need to convert temperature from °C to K because the change in temperature is the same in both scales.
Polystyrene-cup calorimetry
Calorimetry Experiments for Reactions in Solution
- For reactions in solution, carry out the reaction with an excess of one reagent and measure the temperature change over a few minutes.
- Use a polystyrene cup to reduce heat loss; a lid and shielding can further reduce heat loss.
- Calculate q using q = m × c × ΔT, then calculate moles of the limiting reagent, and finally ΔH = –q ÷ n (or q ÷ n with sign determined by whether the reaction is exothermic or endothermic).
- For example, excess zinc added to copper(II) sulfate solution: q = m × c × ΔT, moles of CuSO₄ = volume × concentration, ΔH = –q ÷ n.
- The main sources of error are heat loss to surroundings and incomplete reaction.
Temperature Correction Graphs
- For reactions that are not instantaneous, there may be a delay before maximum temperature is reached, and heat loss can occur during that delay.
- A temperature correction graph plots temperature against time; the cooling section is extrapolated back to the time of mixing to find the true maximum temperature change.
- Steps: record temperature before adding reactants for a few minutes, add the second reactant and continue recording, plot the graph and extrapolate the cooling part to the time of addition.
- This method assumes the rate of cooling is constant.
- The same analysis can be used for endothermic reactions, but there will be a 'warming' section as substances return to room temperature.
Calorimetry Experiments for Enthalpy of Combustion
- The heat released by a combustion reaction is used to increase the heat content of water in a calorimeter.
- A typical simple calorimeter uses a spirit burner to heat a known mass of water in a copper calorimeter.
- Calculate q = m × c × ΔT for the water, then moles of fuel burned = mass ÷ molar mass, and ΔH = –q ÷ n (converted to kJ mol⁻¹).
- Not all heat produced is transferred to the water; some is lost to the surroundings and some is absorbed by the calorimeter.
- To minimise heat losses, place the calorimeter not too far above the flame, use a lid, and shield to reduce draughts.
- The main sources of error are heat losses and incomplete combustion.
Slide
Sign up free to view the lesson slides
Step through every slide for this topic — plus flashcards and revision notes — with a free account.
Soal latihan
Pratinjau gratis — 8 dari 62 soal. Daftar untuk melihat semuanya.
1.Which statement correctly describes the difference between heat and temperature?
Easy- ATemperature is a measure of the average kinetic energy of the particles, while heat is a measure of the total energy content of a substance.
- BTemperature is a measure of the total energy content of a substance, while heat is a measure of the average kinetic energy of the particles.
- CHeat and temperature are the same physical quantity, just expressed in different units.
- DHeat is measured in kelvin, while temperature is measured in joules.
2.In an exothermic reaction, what happens to the temperature of the surroundings?
Easy- AIt increases because heat is released from the system to the surroundings.
- BIt decreases because heat is absorbed by the system from the surroundings.
- CIt stays the same because energy is conserved.
- DIt increases because heat is absorbed by the system from the surroundings.
3.Which of the following is the correct symbol for the standard enthalpy change of formation?
Easy- AΔHf⦵
- BΔHc⦵
- CΔHr⦵
- DΔHneut⦵
4.Which of the following statements about standard enthalpy changes are correct? (select all that apply)
Medium- AThe standard enthalpy of combustion is always exothermic.
- BThe standard enthalpy of formation can be either exothermic or endothermic.
- CThe standard enthalpy of neutralisation is always endothermic.
- DThe standard enthalpy of reaction can be either exothermic or endothermic.
- EThe standard enthalpy of combustion can be either exothermic or endothermic.
5.In an isolated system, neither matter nor energy can be exchanged with the surroundings.
EasyTrue or false?
6.The Law of Conservation of Energy states that energy can be created and destroyed in a chemical reaction.
EasyTrue or false?
7.Match each term with its correct definition.
Medium- Enthalpy change of reaction
- Enthalpy change of formation
- Enthalpy change of combustion
- Enthalpy change of neutralisation
- The enthalpy change when one mole of a compound is formed from its elements under standard conditions.
- The enthalpy change when one mole of a substance is burnt in excess oxygen under standard conditions.
- The enthalpy change when one mole of water is formed by reacting an acid and alkali under standard conditions.
- The enthalpy change when the reactants in the stoichiometric equation react to give the products under standard conditions.
8.Place the following steps of a temperature correction graph for a calorimetry experiment in the correct order.
Medium- Take a temperature reading before adding the reactants for a few minutes to get a steady value.
- Add the second reactant and continue recording the temperature and time.
- Plot the graph and extrapolate the cooling part of the graph until it intersects the time at which the second reactant was added.
Unlock all 62 questions & more
Buat akun gratis untuk melihat setiap soal, slide, kartu flash, dan catatan ulasan topik ini.