Solving And Graphing Inequalities
Belajar sambil bermain
Jawab soal-soal ini untuk dapat energi, lalu memancing dan menjelajah. Tanpa akun.
Catatan pelajaran
Representing Inequalities as Regions
- A 2D inequality (e.g. y < x, x + y ≥ 8) has a solution region in the xy-plane.
- To draw the boundary line, replace the inequality sign with '=' and draw that line.
- Use a solid line for ≤ or ≥ (line included); use a dotted line for < or > (line not included).
- For y ≤ ... or y < ..., the wanted region is below the line; for y ≥ ... or y > ..., it is above.
- For vertical lines: x < k → left of x = k; x > k → right of x = k.
- If unsure, test a point (e.g. (0,0)) to see which side satisfies the inequality.
- Shade the unwanted sides of each line to leave the wanted region clear; label it R.
Representing a system of inequalities as a shaded region
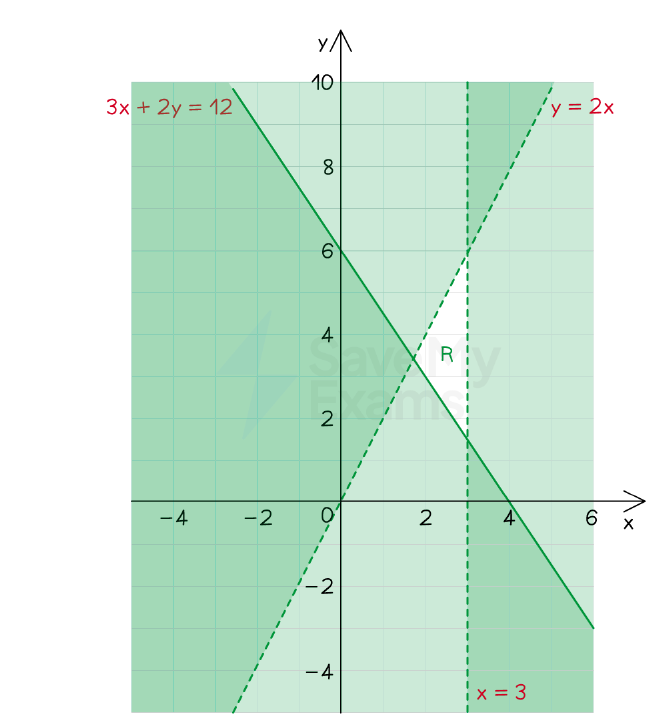
Finding Inequalities from Regions
- Identify the equation of each boundary line (use y = mx + c or x = k, y = k).
- Note whether the line is solid (≤ or ≥) or dotted (< or >).
- If the shaded region is below the line, use ≤ or <; if above, use ≥ or >.
- For vertical lines: region left of x = k → ≤ or <; right → ≥ or >.
- Test a point from the shaded region to confirm the inequality sign.
- Write all inequalities together as the final answer.
Finding the inequalities that define a shaded region
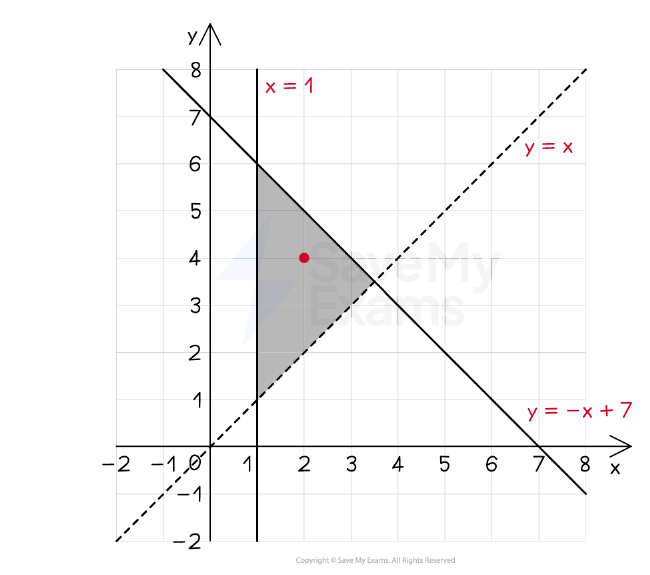
Solving Linear Inequalities
- Solve inequalities similarly to equations, but reverse the inequality sign when multiplying/dividing by a negative number.
- Example: 3x + 12 < 5x - 3 → subtract 3x: 12 < 2x - 3 → add 3: 15 < 2x → x > 7.5.
- Example: 3n - 5 > 17 + 8n → subtract 3n: -5 > 17 + 5n → subtract 17: -22 > 5n → n < -4.4.
- Always check your solution by substituting a value back into the original inequality.
Shading Unwanted Regions (Exam Technique)
- Read carefully: the question may ask you to shade unwanted regions or the wanted region.
- Shading unwanted regions leaves the wanted region unshaded (clear).
- Draw all boundary lines first, then shade each unwanted side.
- Label the final wanted region with the letter R.
- Use a test point (e.g. (0,0)) to decide which side to shade for each inequality.
Integer Solutions in a Region
- Sometimes you need to find integer coordinates (x, y) inside a region that satisfy an additional equation.
- List all integer points inside the region and check which satisfy the given equation.
- Example: find (x, y) with integer coordinates inside R such that 3x + 5y = 35.
Word Problems: Forming Inequalities
- Translate conditions into inequalities: 'fewer than 10 mats' → y < 10; 'at least 15 silver balloons' → x ≥ 15.
- 'More gold than silver' → y > x; 'total no more than 70' → x + y ≤ 70.
- For time constraints: e.g. 2.25 hours per basket and 1.5 hours per mat, max 22.5 hours → 2.25x + 1.5y ≤ 22.5 → multiply by 4: 9x + 6y ≤ 90 → divide by 3: 3x + 2y ≤ 30.
- Always define variables clearly (e.g. x = number of baskets, y = number of mats).
Graphing Multiple Inequalities
- Draw all boundary lines on the same axes using correct line styles (solid/dotted).
- Shade the unwanted region for each inequality; the remaining unshaded area is the solution region.
- Label the solution region R.
- Check that a point inside R satisfies all inequalities.
Slide
Sign up free to view the lesson slides
Step through every slide for this topic — plus flashcards and revision notes — with a free account.
Soal latihan
Pratinjau gratis — 8 dari 51 soal. Daftar untuk melihat semuanya.
1.Which inequality represents the region below the line y = 3x + 2, including the line?
Easy- Ay ≤ 3x + 2
- By < 3x + 2
- Cy ≥ 3x + 2
- Dy > 3x + 2
2.Which line would be drawn as a dotted line when graphing the inequality y > 2x - 1?
Easy- Ay = 2x - 1
- By = 2x + 1
- Cy = -2x - 1
- Dy = -2x + 1
3.The inequality x ≥ 3 is represented on a graph by a vertical line at x = 3. Which side is the wanted region?
Easy- ATo the right of the line
- BTo the left of the line
- CAbove the line
- DBelow the line
4.Solve the inequality 3x + 12 < 5x - 3.
Medium- Ax > 7.5
- Bx < 7.5
- Cx > 3
- Dx < 3
5.Solve the inequality 3n - 5 > 17 + 8n.
Medium- An < -4.4
- Bn > -4.4
- Cn < 4.4
- Dn > 4.4
6.Solve the inequality x/2 - 13 > 12 + 3x.
Medium- Ax < -10
- Bx > -10
- Cx < 10
- Dx > 10
7.Which inequality is represented by the solid line y = 2x + 3 and the region above it?
Easy- Ay ≥ 2x + 3
- By > 2x + 3
- Cy ≤ 2x + 3
- Dy < 2x + 3
8.A region is defined by y ≤ 2, x ≥ 1, and y ≥ x. Which point lies inside the region?
Medium- A(2, 2)
- B(0, 0)
- C(3, 4)
- D(1, 3)
Unlock all 51 questions & more
Buat akun gratis untuk melihat setiap soal, slide, kartu flash, dan catatan ulasan topik ini.