Designing and evaluating biology investigations
遊んで学ぼう
問題に答えてエネルギーを集めたら、釣りや探検を楽しもう。アカウント不要。
教育者の方へ: Designing and evaluating biology investigations(MYP Biology、Year 5)向けのすぐ使えるレッスンスライド, 復習ノート — レッスンで使うか、学習者がライブゲームとして遊ぶインタラクティブなクラス活動としてトピックを実施できます。
レッスンノート
Big idea: evidence you can trust
- Big idea (key concept): Change. Biology investigations ask how one thing changes when another is changed: a plant's growth when its light changes, or a heart rate when exercise changes.
- Related concept: Evidence. A claim in science is only as good as the evidence behind it. This lesson is about collecting data that is good enough to trust and judging how far a conclusion can go.
- Global context: Scientific and technical innovation. New treatments, crops and technologies depend on investigations that other people can repeat and check.
- A scientific investigation follows a cycle: question → hypothesis → plan (variables, method, safety) → collect data → process and present → conclusion → evaluation.
- A hypothesis is a testable prediction with a scientific reason, for example:×"Increasing temperature from 10 °C to 40 °C will increase the rate of respiration in yeast, because the enzymes work faster."×
- Every investigation must also be safe and ethical: carry out a risk assessment (for example eye protection, handling hot water carefully), obtain informed consent from human participants, and treat living organisms with care.
Variables and controls
- The independent variable is the one you deliberately change. The dependent variable is the one you measure to see the effect. Control variables are everything else that could affect the result and must be kept the same.
- Example: to test the effect of temperature on yeast respiration, the independent variable is temperature (°C), the dependent variable is the number of bubbles per minute, and the control variables include the mass of yeast, the volume and concentration of sugar solution, and the time over which bubbles are counted.
- A fair test changes only one factor at a time. If two factors change together, you cannot tell which caused the effect, so the investigation is not valid.
- A control experiment is a set-up that does not receive the treatment, such as a tube with boiled yeast or a pot with no fertiliser. It gives a baseline to compare with and shows that the effect really comes from the independent variable.
- Sometimes a variable cannot be fully controlled, such as the genetic differences between plants. Use many individuals, choose them randomly, and then calculate a mean.
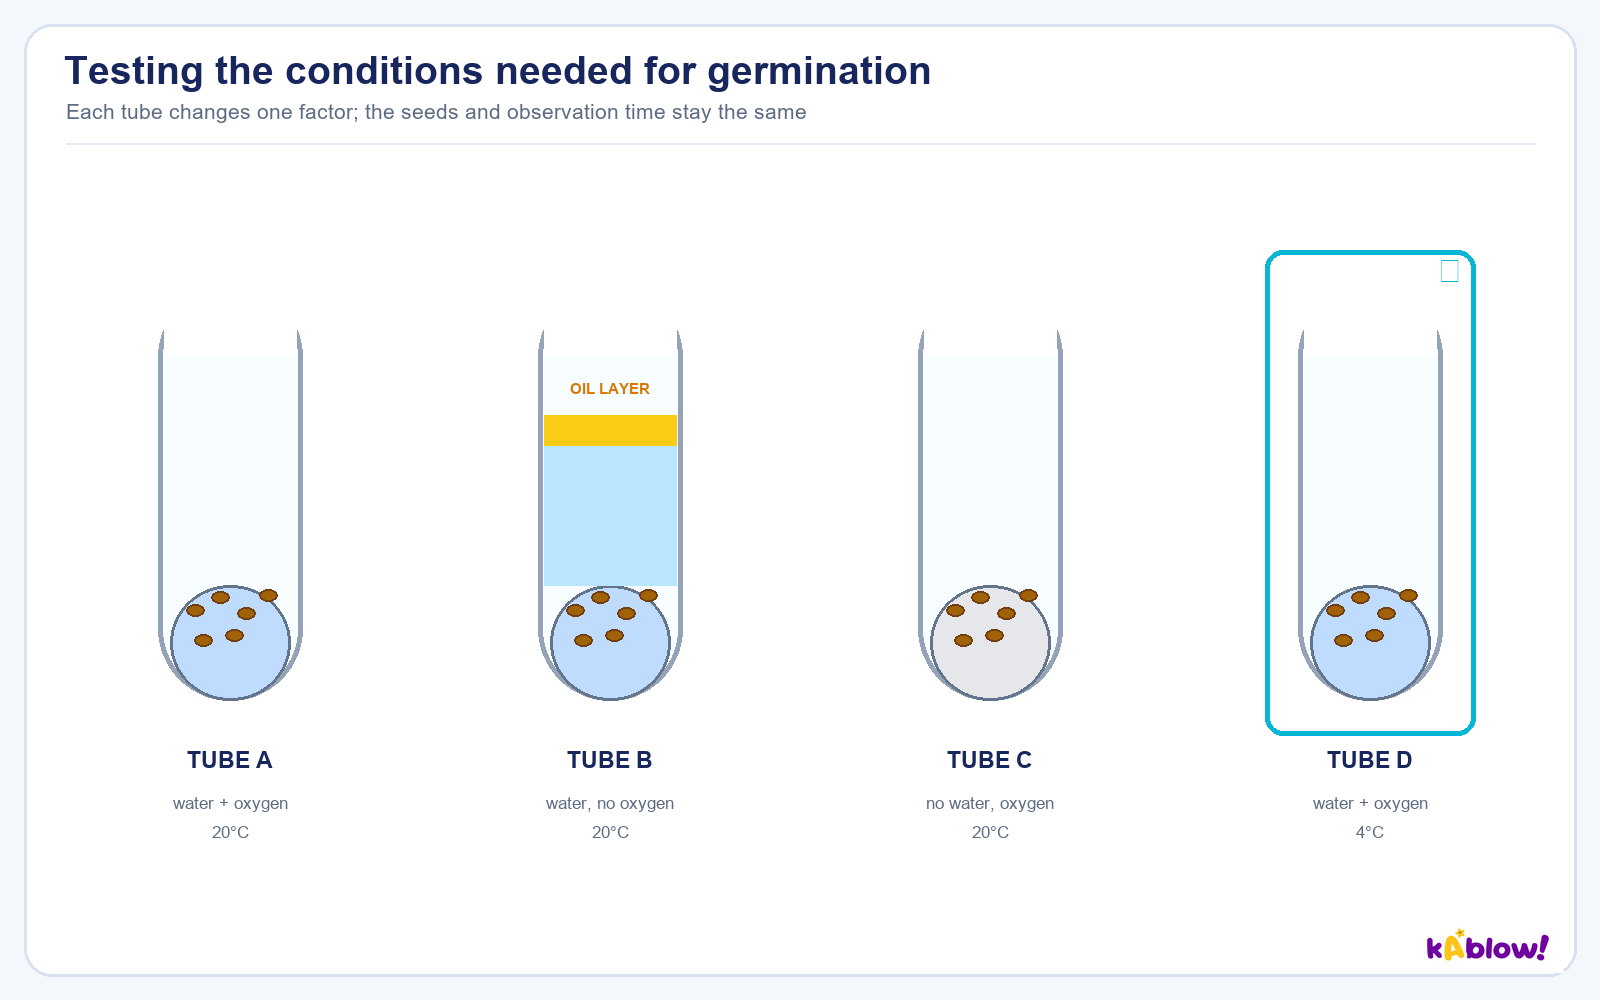
- In the germination set-up, tube A has water, oxygen and 20 °C. Each other tube differs from A in just one factor, so each comparison with A is a fair test of that one factor.
Four tubes, each changing one factor
Quality of data: accuracy, precision, reliability, validity
- Accuracy is how close a measurement is to the true value. Precision is how close repeat measurements are to each other. A set of readings can be precise but not accurate.
- Example: the true mass is 20.0 g. Readings of 22.1, 22.0 and 22.2 g are precise (close together) but not accurate (all too high). Readings of 19.9, 20.1 and 20.0 g are both precise and accurate.
- Reliable results can be repeated and give similar answers, either by you or by other people. Taking repeats, using more individuals and calculating a mean improve reliability.
- A valid investigation measures what it claims to measure and controls all other variables. A reliable result can still be invalid if the method is flawed.
- Resolution is the smallest change an instrument can show. A measuring cylinder marked every 0.2 cm³ has a better resolution than one marked every 1 cm³. A common estimate of reading uncertainty is ± half the smallest division.
- Random errors make readings vary unpredictably, for example misjudging a colour change. Repeats and means reduce them. Systematic errors push every reading in the same direction, for example a balance that reads 0.5 g with nothing on it. Repeating does not remove a systematic error; the instrument or method must be corrected.
- An anomaly is a result that does not fit the pattern. Check it for a mistake, repeat it if you can, and if you leave it out of the mean, say so and explain why.
Recording and presenting data
- Draw a table before you start. Put the independent variable in the first column. Each column heading names the quantity and its unit, for example×Temperature (°C)×. Record all repeat readings, then a mean column.
- Record readings to the same number of decimal places, and to the resolution of the instrument.
- Choose the right chart. Use a bar chart when the independent variable is a category (type of fertiliser). Use a line graph when both variables are continuous numbers (temperature and rate). Use a scatter graph to look for a relationship between two measured variables (such as height and arm length).
- Put the independent variable on the x-axis and the dependent variable on the y-axis. Label both axes with quantity and unit. Choose a scale that uses more than half of the grid and has equal steps.
- Plot points accurately. For a continuous relationship draw a smooth line of best fit or a curve through the trend; do not join points dot-to-dot unless the shape is clearly a series of straight steps.
- To read a rate from a graph, find the gradient: change in y ÷ change in x. A steeper line means a faster rate. A flat line means no change.
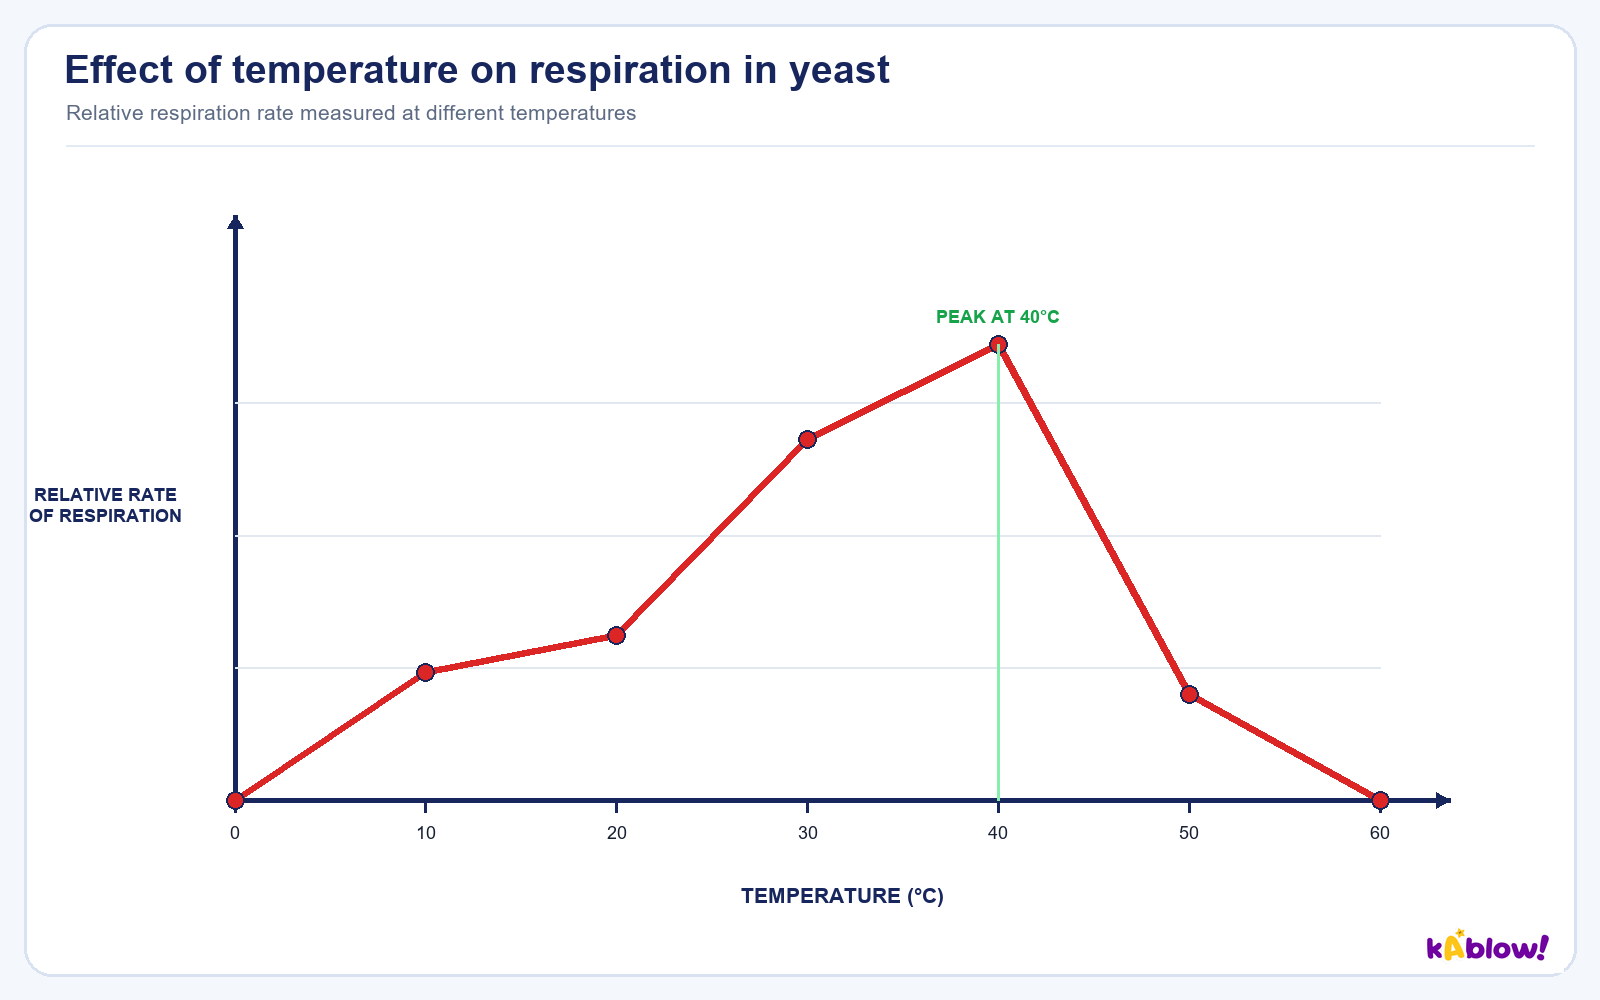
A rate graph: yeast respiration against temperature
Processing data: means, ranges, percentages and rates
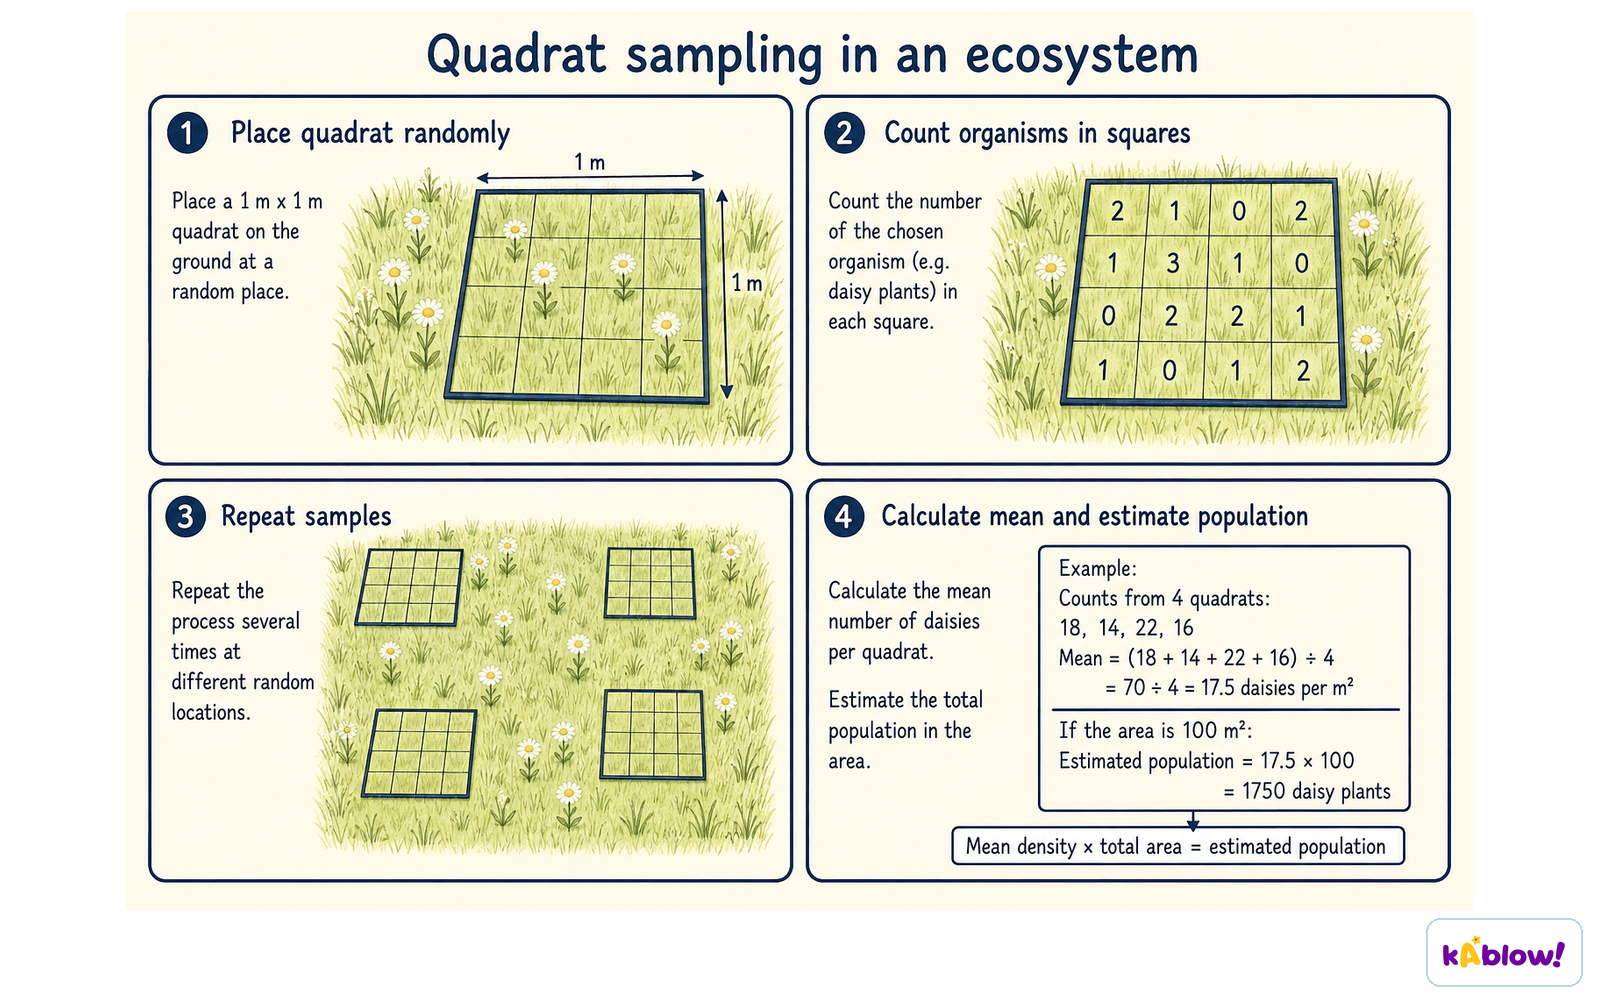
- Mean = total of the values ÷ number of values. Example: counts of 18, 14, 22 and 16 per m² total 70, so the mean is 17.5 per m².
- Range = highest − lowest. A small range means the repeats agree well (high precision). A large range suggests random error or an anomaly.
- Ignore anomalies when you calculate a mean, and say why. Example: 34, 36, 35 and 52. The 52 is an anomaly, so the mean of the other three is (34 + 36 + 35) ÷ 3 = 35.
- Percentage change = (new − old) ÷ old × 100. Example: a resting pulse of 72 beats per minute rises to 126 after exercise, so the change is 54 ÷ 72 × 100 = 75%. A negative answer is a percentage decrease.
- Rate = amount ÷ time. Example: 24 cm³ of gas collected in 3 minutes is a rate of 8 cm³ per minute. Always include the unit.
- Write calculation steps clearly, show the working, and give the answer to a sensible number of significant figures (usually the same as the data).
Processing repeat counts to a mean
Think like a scientist: conclusions and evaluation
- A conclusion answers the original question using the data. State the pattern (for example, the rate rose to 40 °C then fell), quote numbers from the results (with units), link it to the hypothesis and explain it using science (enzymes work fastest at their optimum and denature above it).
- Do not claim more than the data show. If you tested 10 to 50 °C, you cannot say what happens at 80 °C. Use cautious language: "suggests", "supports", "is consistent with".
- Correlation is not causation. Two things that change together may both be caused by a third factor. Storks and human births both rise in towns with more houses, but storks do not deliver babies.
- Evaluate the method: were variables controlled? Were there enough repeats and a large enough sample? Were the instruments resolved finely enough? Were there anomalies or systematic errors? Then suggest a specific improvement for each weakness.
- Typical improvements: more repeats and a larger sample, a finer instrument, a narrower range of values close to the peak, a water bath to hold temperature steady, and random selection of individuals.
- Inquiry task: a class wants to find out how caffeine-free fizzy drink affects the growth of cress seedlings compared with water. Write the hypothesis, name the three types of variable, say how many seedlings per group and why, describe how the data will be recorded and processed, and list two limits of the method.
スライド
練習問題
無料プレビュー — 54問中8問。すべて見るには登録を。
1.What is the independent variable in an investigation?
Easy- AThe variable that you measure to find the effect
- BA variable that you keep the same throughout
- CThe variable that you deliberately change
- DThe result that you expect to find at the end
2.A student counts the bubbles of gas given off by yeast at different temperatures. What is the dependent variable?
Easy- AThe number of bubbles per minute
- BThe temperature of the water
- CThe mass of yeast in each tube
- DThe time the experiment is left for
3.What is a control variable?
Easy- AThe factor that is changed on purpose
- BThe measurement that gives the result
- CThe group that gets no treatment at all
- DA factor that is kept the same so that the test is fair
4.In a fair test, several variables should be changed at the same time to save time.
EasyTrue or false?
5.Match each term to its meaning.
Easy- Hypothesis
- Anomaly
- Reliable results
- Valid investigation
- A result that does not fit the pattern of the others
- A test that measures what it claims to measure
- A testable prediction that includes a scientific reason
- Results that can be repeated with similar answers
6.What does accuracy mean?
Easy- AHow close repeat measurements are to each other
- BHow close a measurement is to the true value
- CHow many readings were taken in total
- DHow many decimal places the instrument shows
7.What does precision mean?
Easy- AHow close a measurement is to the true value
- BWhether the experiment was safe to carry out
- CWhether the hypothesis turned out to be correct
- DHow close repeat measurements are to each other
8.Complete the sentence about accuracy precision.
EasyThe smallest change that a measuring instrument can show is called its ____.
過去問
このトピックの過去問練習は近日公開。
近日公開