Speed and motion graphs
遊んで学ぼう
問題に答えてエネルギーを集めたら、釣りや探検を楽しもう。アカウント不要。
教育者の方へ: Speed and motion graphs(MYP Physics、Year 1)向けのすぐ使えるレッスンスライド, 復習ノート — レッスンで使うか、学習者がライブゲームとして遊ぶインタラクティブなクラス活動としてトピックを実施できます。
レッスンノート
Big idea: describing how things move
- Big idea. Key concept: Change. Motion is a change of position over time, and we can describe it with numbers and graphs.
- Related concept: Movement. Physicists describe movement using distance, time and speed.
- Global context: Orientation in space and time. Knowing where things are and how fast they move lets us plan journeys, from walking to school to launching a satellite.
- Distance is how far an object travels along its path. It is measured in metres (m) or kilometres (km). 1 km = 1000 m.
- Time is how long the movement takes. It is measured in seconds (s), minutes (min) or hours (h).
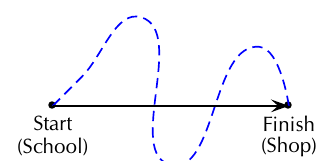
- If you walk from school to the shop along a winding path, the distance you travel is the length of the winding path, which is longer than the straight line between them.
Distance travelled along a winding path
Speed = distance / time
- Speed tells us how far an object travels in each unit of time.
- The equation is speed = distance ÷ time.
- If a runner covers 100 m in 20 s, the speed is 100 m ÷ 20 s = 5 m/s. This means the runner travels 5 metres every second.
- Rearranged, distance = speed × time and time = distance ÷ speed.
- A walker moving at 4 m/s for 30 s travels 4 m/s × 30 s = 120 m. A person walking 600 m at 1.5 m/s takes 600 m ÷ 1.5 m/s = 400 s.
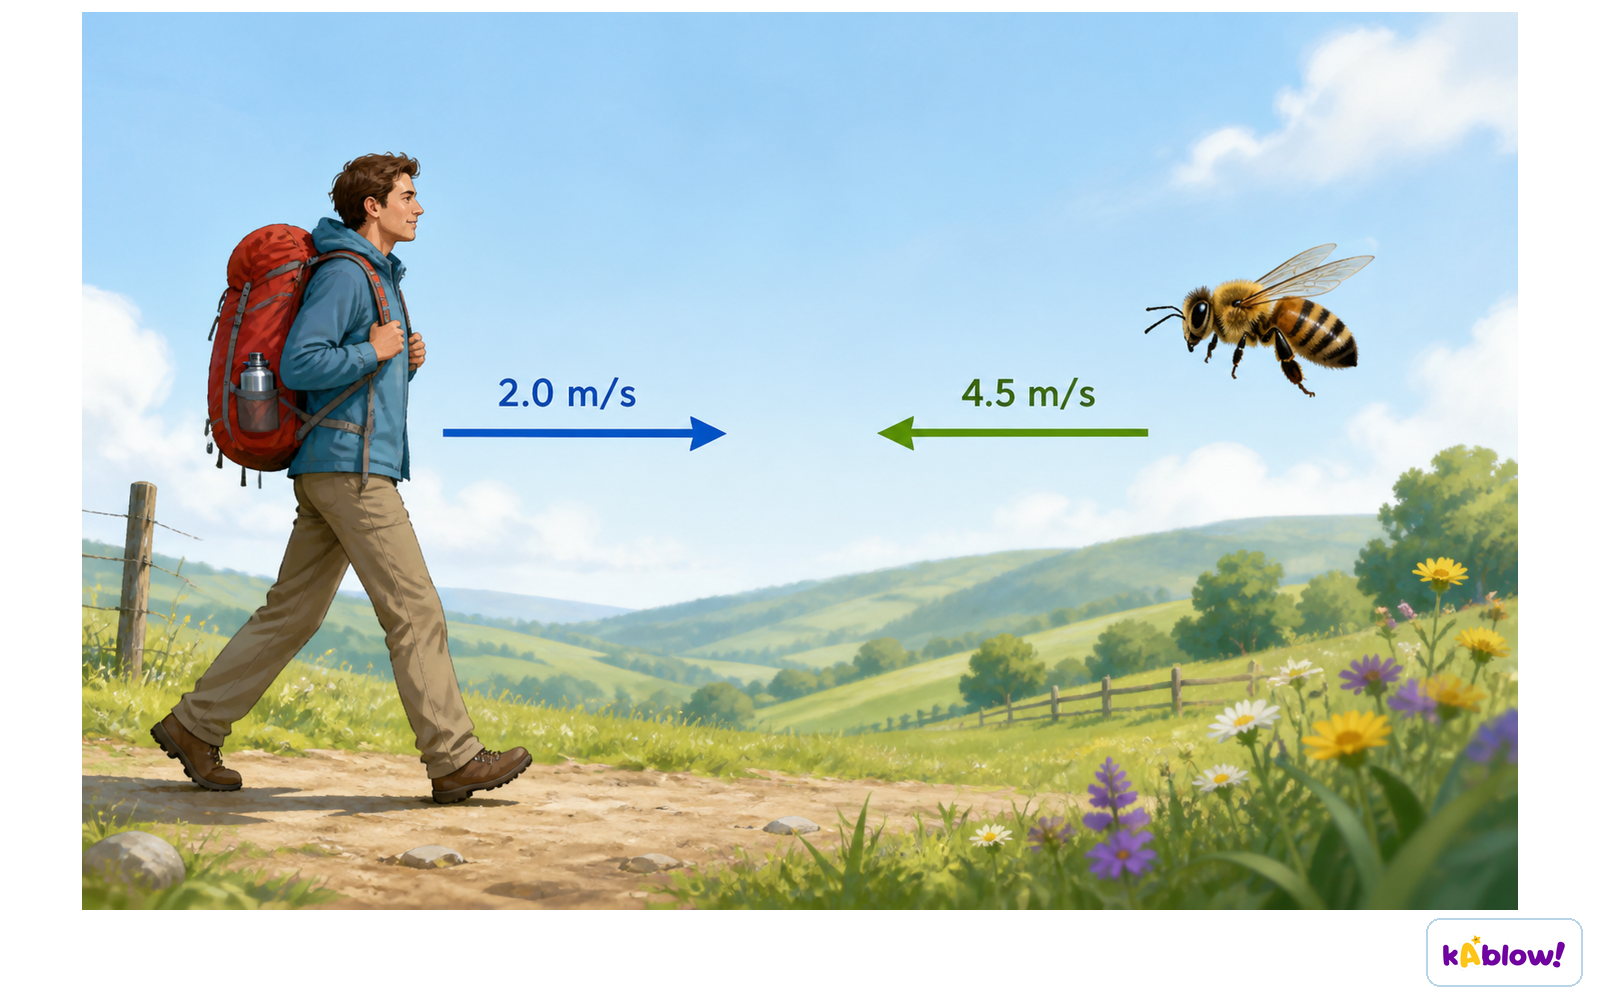
- Typical speeds are about 1.5 m/s for walking, about 5 to 6 m/s for cycling and about 30 m/s for a car on a motorway.
A walker and a bee at different speeds
Units and average speed
- Speed is measured in metres per second (m/s) or kilometres per hour (km/h). Always write the unit with your answer.
- To change m/s into km/h, multiply by 3.6. To change km/h into m/s, divide by 3.6. So 20 m/s = 72 km/h, and 36 km/h = 10 m/s.
- Before you calculate, make sure distance and time use matching units. 45 minutes is 0.75 hours, because 45 ÷ 60 = 0.75.
- Real journeys have stops and changes of speed. Average speed = total distance ÷ total time.
- Example: a ride covers 9 km in 50 minutes. 50 min = 50 ÷ 60 h = 0.83 h, so the average speed is 9 km ÷ 0.83 h = about 10.8 km/h.
- A car's speedometer shows the speed at one moment. The average speed over a whole journey is usually lower than the highest speed because of stops and slow sections.
Distance-time graphs
- A distance-time graph shows how far an object has travelled as time goes on. Time is on the horizontal axis and distance is on the vertical axis.
- A flat, horizontal line means the distance is not changing, so the object is stationary.
- A straight line sloping upwards means the object is moving at a constant speed.
- A steeper line means a faster speed, because more distance is covered in the same time.
- A line that curves upwards and gets steeper means the object is speeding up.
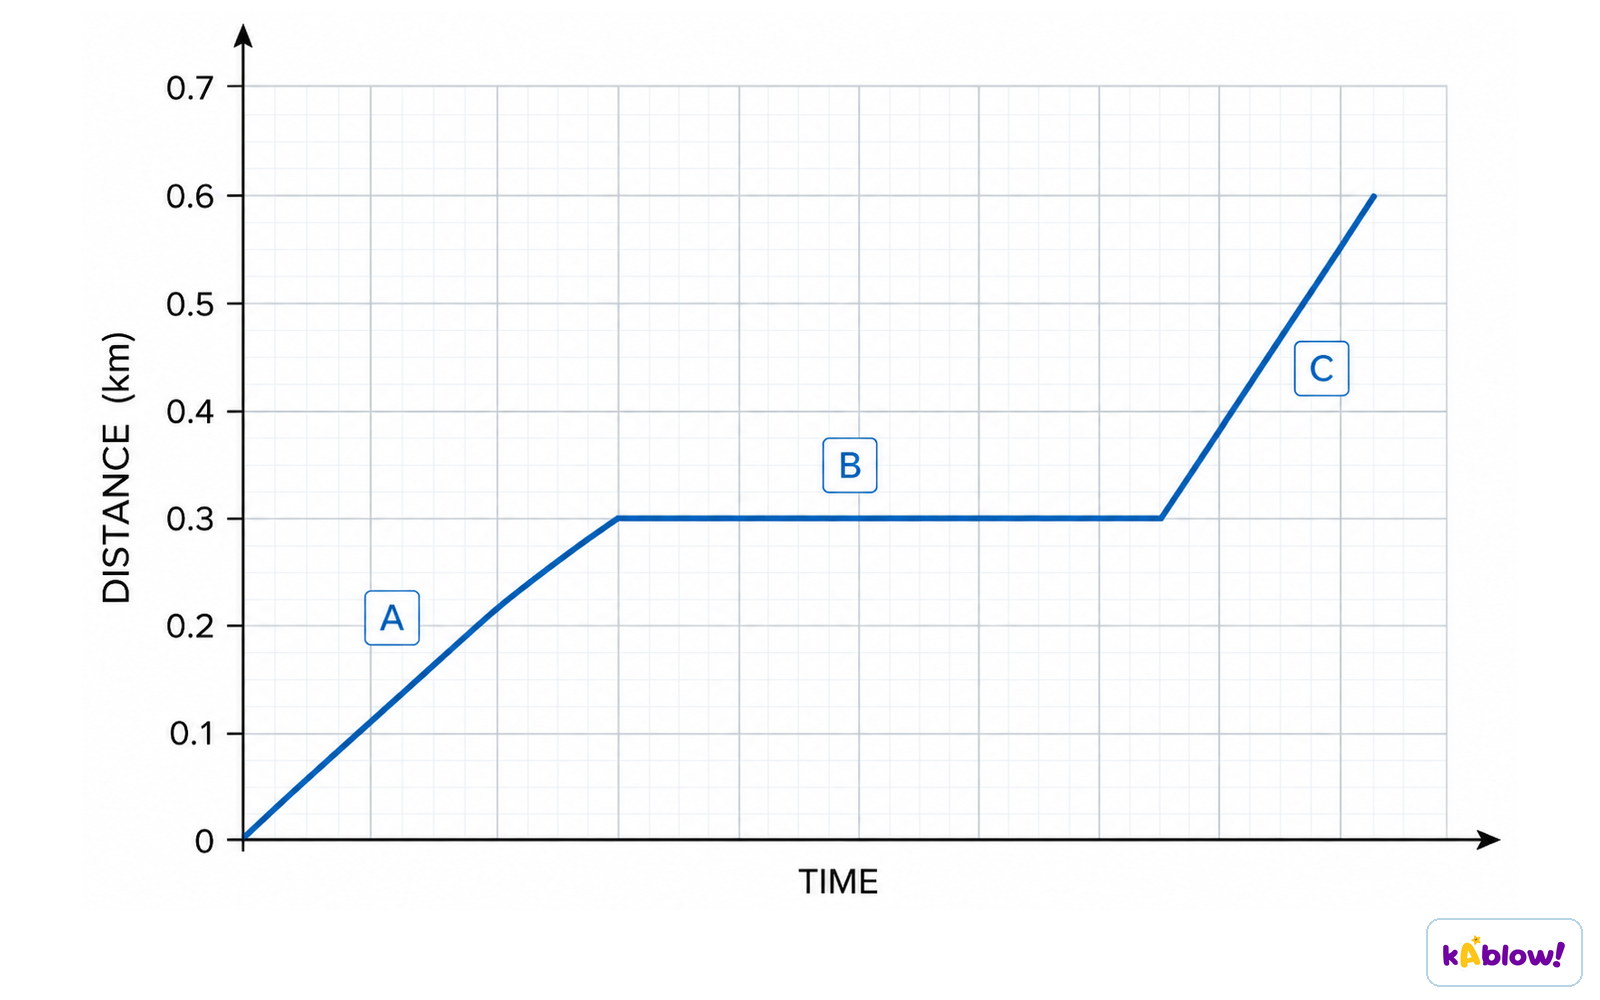
- The graph for the journey in the picture has three sections: moving (A), stopped (B) and moving faster (C).
A journey with a moving, a stopped and a faster section
Gradient and speed
- The gradient (slope) of a distance-time graph tells you the speed.
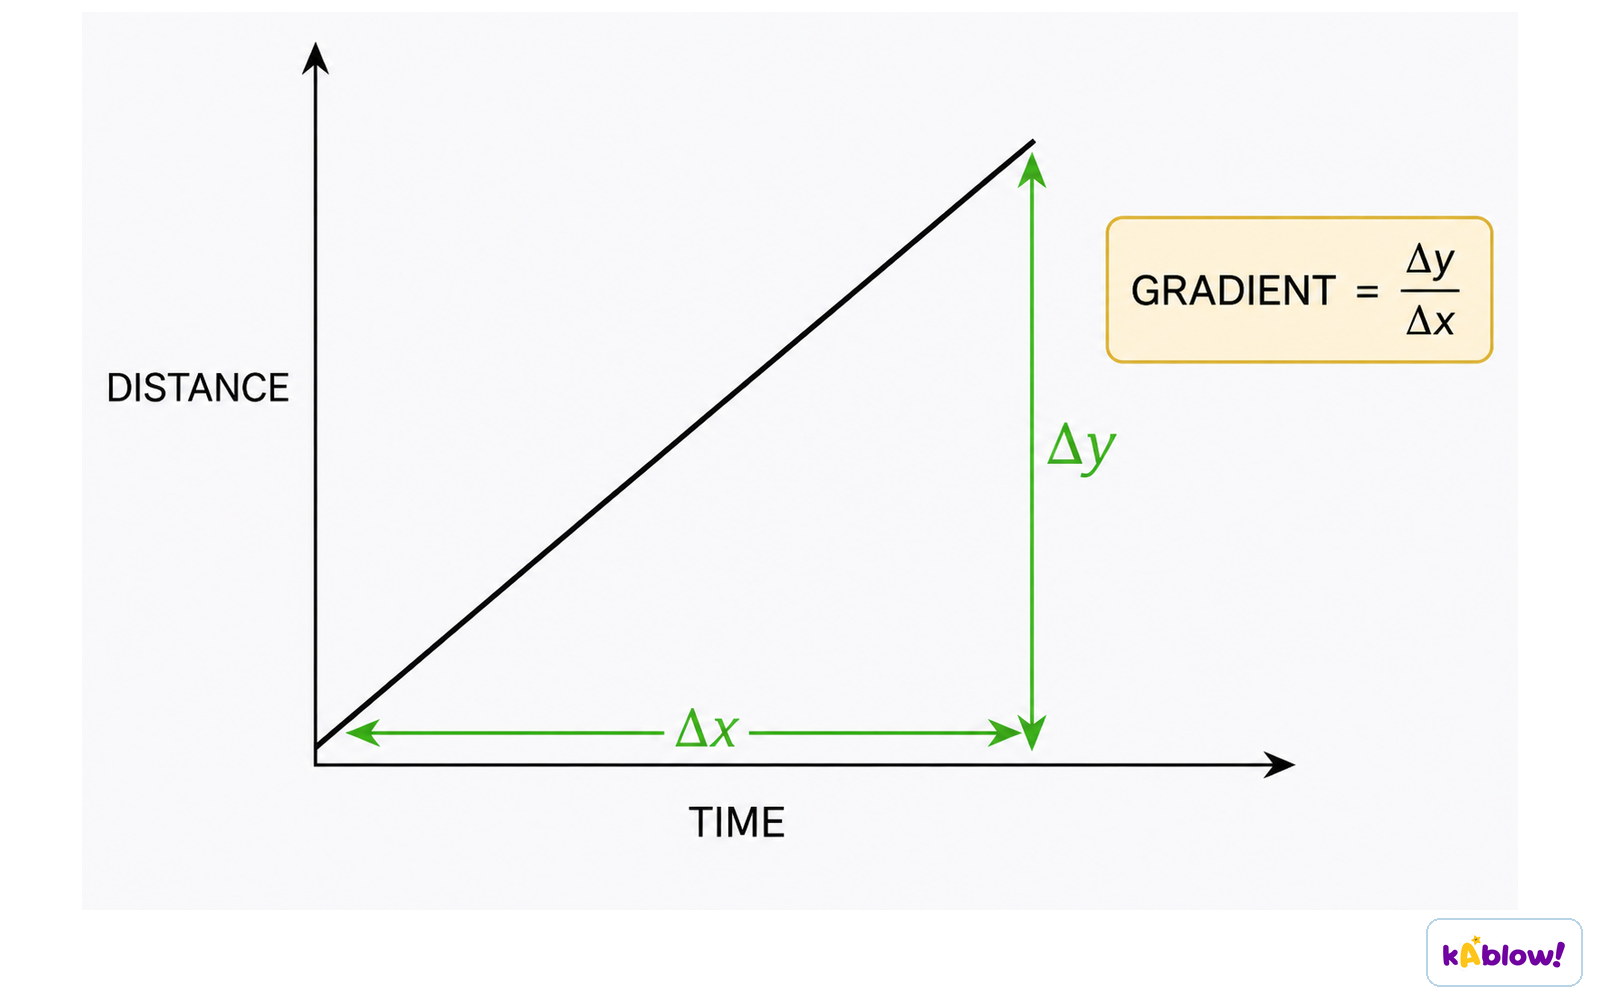
- Gradient = change in distance ÷ change in time. On a graph, this is the rise divided by the run.
- Example: an object is 8 m from the start at 4 s and 26 m from the start at 10 s. The change in distance is 26 - 8 = 18 m and the change in time is 10 - 4 = 6 s. The speed is 18 m ÷ 6 s = 3 m/s.
- To find the speed from a graph, draw a large triangle on the straight part of the line, read the rise and run, and divide. A large triangle gives a more accurate answer.
- You can also read distances straight off the graph, such as how far the object has gone after 10 s.
- To compare two objects, plot both on the same axes. The one with the steeper line is faster.
Finding speed from the gradient of a graph
Think like a scientist: timing a trolley
- Question: does the height of a ramp change how fast a trolley travels along a bench?
- Mark a start line and a finish line 2.0 m apart. Release the trolley, start a stopwatch as it passes the start and stop it as it crosses the finish. Use speed = distance ÷ time.
- The independent variable is the ramp height. The dependent variable is the speed. Control variables include the same trolley, the same ramp surface and the same start and finish lines.
- A hand-held stopwatch has reaction-time error at the start and the finish. Using a longer distance, or light gates, reduces its effect.
- To make results more reliable, repeat each timing at least three times and use the mean. For example, times of 4.2 s, 4.0 s and 4.4 s have a mean of 4.2 s, giving a speed of 2.0 m ÷ 4.2 s = about 0.48 m/s.
- Inquiry task: plan a fair test to compare how fast two people walk 20 m. List your variables, say what you will measure and how you will reduce timing errors, and say how you will decide who is faster.
スライド
練習問題
無料プレビュー — 54問中8問。すべて見るには登録を。
1.Which is the correct equation for speed?
Easy- ASpeed = distance ÷ time
- BSpeed = distance × time
- CSpeed = time ÷ distance
- DSpeed = distance + time
2.Which of these is a unit of speed?
Easy- AKilogram (kg)
- BNewton (N)
- CSquare metre (m²)
- DMetre per second (m/s)
3.What does a horizontal line on a distance-time graph show?
Easy- AThe object is speeding up
- BThe object is moving at a constant speed
- CThe object is stationary
- DThe object is going backwards
4.Which quantity is usually plotted on the horizontal axis of a distance-time graph?
Easy- ATime
- BSpeed
- CDistance
- DMass
5.Which of these moves with the greatest speed?
Easy- AA walker at 1.5 m/s
- BA runner at 4 m/s
- CA cyclist at 6 m/s
- DA person on a slow stroll at 0.8 m/s
6.How do you change a speed in m/s into a speed in km/h?
Medium- ADivide by 3.6
- BDivide by 60
- CMultiply by 3.6
- DMultiply by 1000
7.Two objects are plotted on the same distance-time graph. Line X is steeper than line Y. What does this tell you?
Medium- AY is faster than X
- BX is faster than Y
- CX and Y are both stationary
- DX and Y have the same speed
8.How can you find the speed from a straight line on a distance-time graph?
Medium- ARead the highest distance on the graph
- BFind the area under the line
- CRead the time at the end of the line
- DDivide the change in distance by the change in time
過去問
このトピックの過去問練習は近日公開。
近日公開