Acceleration and motion graphs
플레이하며 배우기
이 문제들을 풀어 에너지를 얻은 뒤 낚시하고 탐험하세요. 계정이 필요 없어요.
교육자를 위해: Acceleration and motion graphs(MYP Physics, Year 3)을(를) 위한 바로 쓸 수 있는 수업 슬라이드, 복습 노트 — 수업에 사용하거나, 학습자들이 실시간 게임으로 즐기는 인터랙티브 클래스 활동으로 진행하세요.
수업 노트
Big idea: acceleration and motion graphs
- Key concept: Relationships. Acceleration is change in velocity divided by time. The gradient of a velocity-time graph gives acceleration and the area beneath it gives displacement.
- Related concepts: Models and evidence. Use a scientific explanation to make predictions, then test it against observations.
- Global context: Scientific and technical innovation. Motion models help analyse transport and stopping distances.
Speed & Velocity
- Speed = distance travelled per unit time; a scalar quantity (magnitude only).
- Equation: v = \frac{s}{t}, where v in m/s, s in m, t in s.
- Average speed = total distance / total time; useful when speed varies.
- Velocity = speed in a given direction; a vector quantity (magnitude and direction).
- Velocity uses displacement (vector) instead of distance.
- Same speed but different directions → different velocities.
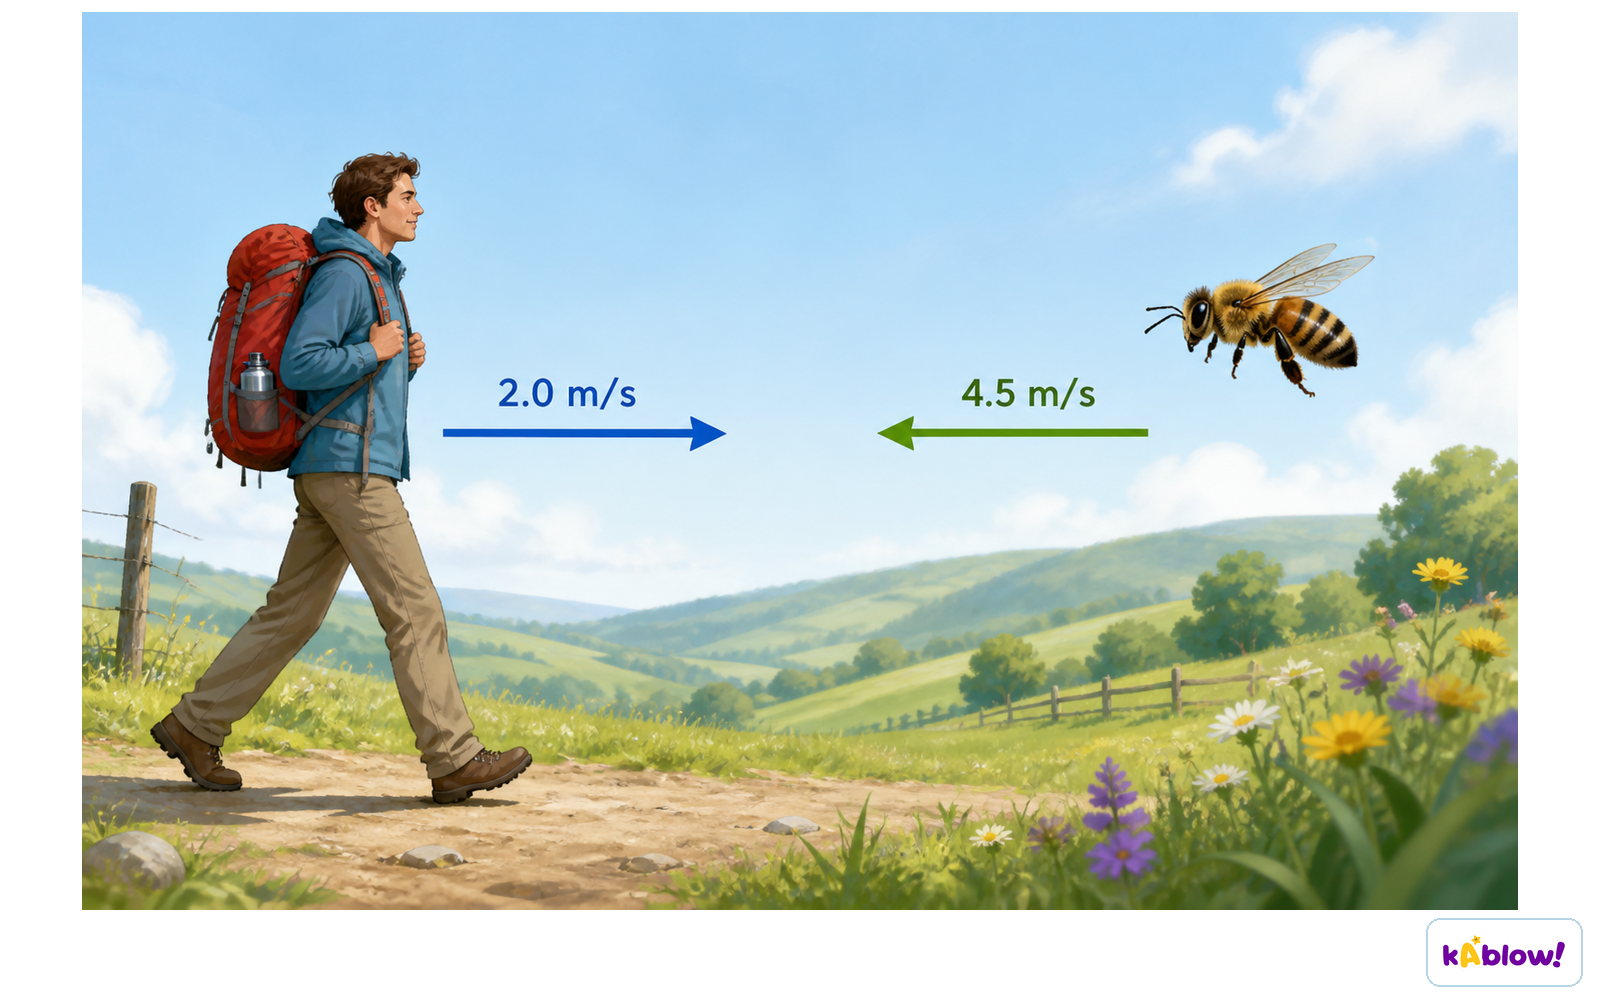
A person walking at 2.0 m/s and a bee flying at 4.5 m/s, illustrating speed.
Acceleration
- Acceleration = rate of change of velocity; a = \frac{\Delta v}{\Delta t}, units m/s².
- Change in velocity: \Delta v = v - u (final minus initial).
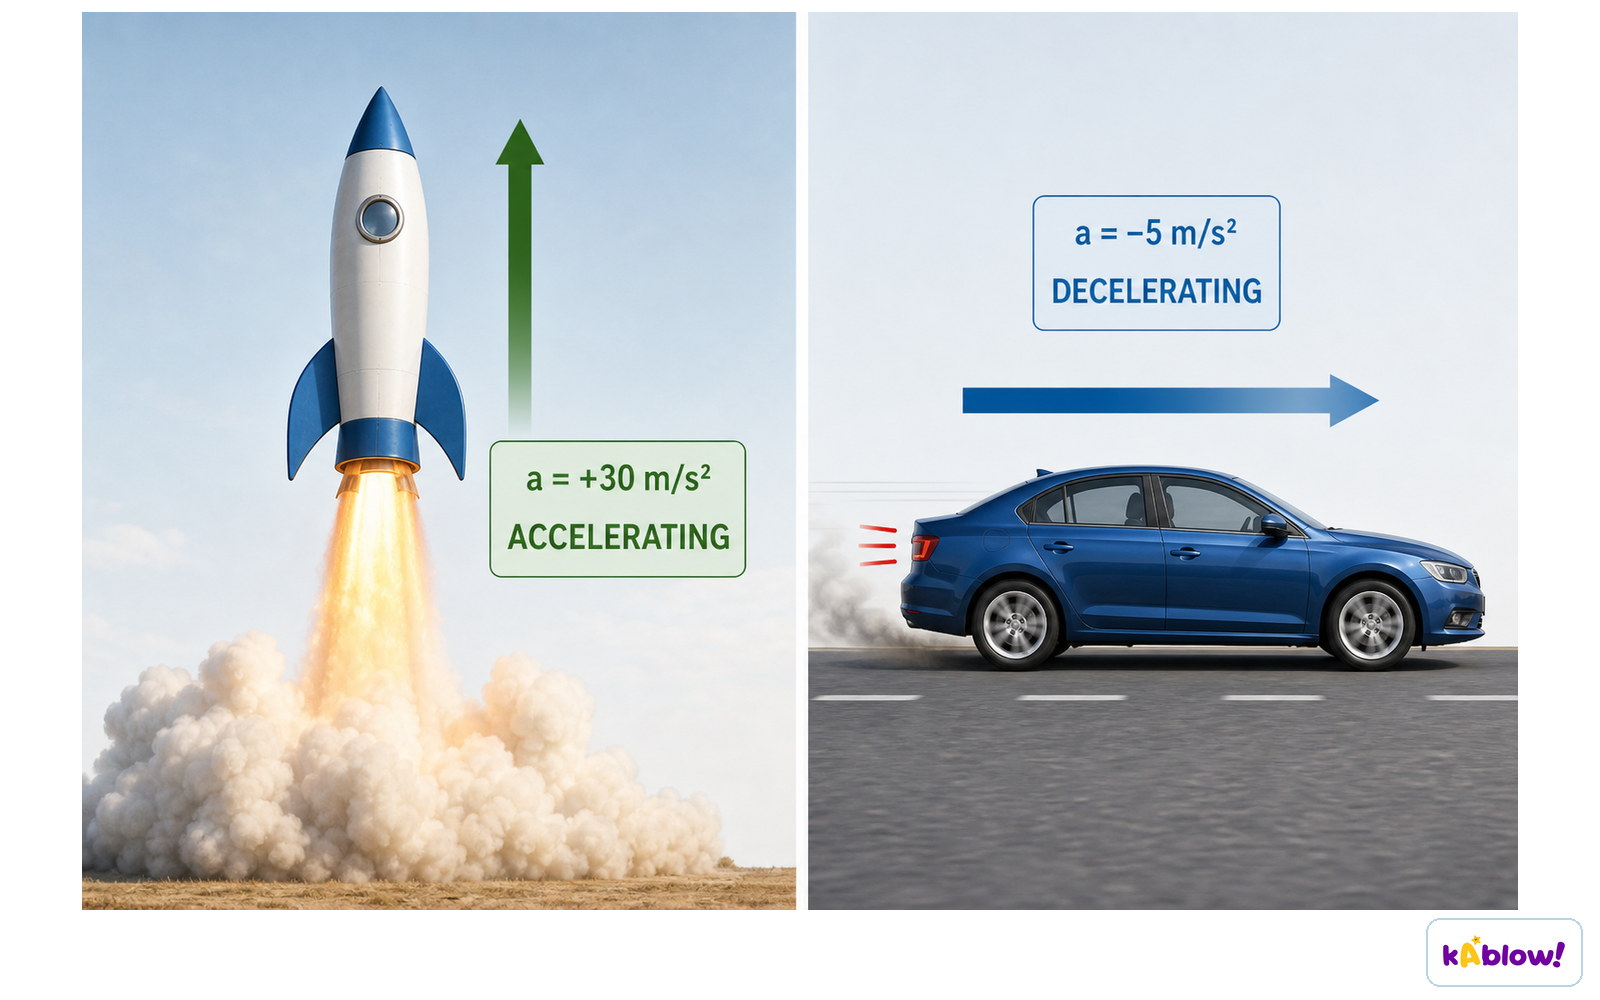
- Positive acceleration = speeding up; negative acceleration (deceleration) = slowing down.
- Any change in velocity (speed up, slow down, change direction) is acceleration.
- Formula triangle: cover the quantity to find; a = \frac{\Delta v}{\Delta t}, \Delta v = a \times \Delta t, \Delta t = \frac{\Delta v}{a}.
Examples of positive and negative acceleration
Distance-Time Graphs
- Distance-time graph: straight line = constant speed; horizontal line = stationary.
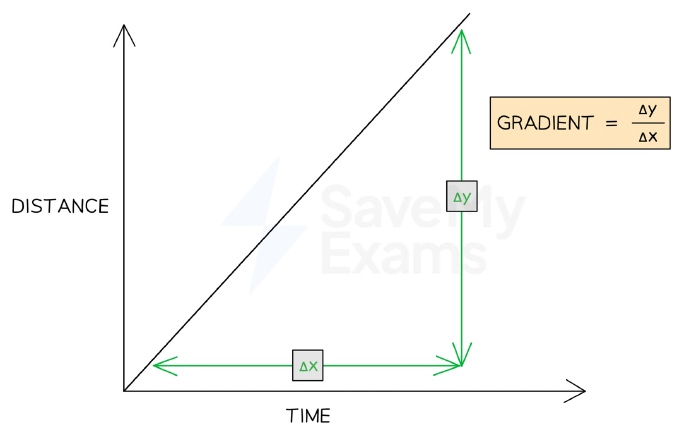
- Gradient = speed; steeper slope = faster speed.
- Curved line = changing speed (acceleration/deceleration); increasing gradient = speeding up, decreasing = slowing down.
- To calculate speed: draw a large gradient triangle, find \frac{\Delta y}{\Delta x}.
- Always check units (e.g., km → m, min → s).
The gradient of a distance-time graph, found from the change in distance (Δy) over the change in time (Δx), gives the speed.
Speed-Time Graphs
- Speed-time graph: straight line = constant acceleration; horizontal line = constant speed (zero acceleration).
- Gradient = acceleration; positive gradient = acceleration, negative = deceleration.
- Area under graph = distance travelled.
- Split area into triangles and rectangles: triangle area = \frac{1}{2}bh, rectangle area = bh.
- Total distance = sum of all areas under the line.
Calculating Acceleration from Speed-Time Graphs
- For constant acceleration: gradient = \frac{\Delta v}{\Delta t} using a straight line.
- For changing acceleration: draw a tangent at the point; gradient of tangent = instantaneous acceleration.
- A tangent is a straight line that just touches the curve at that point.
- Use a large gradient triangle on the tangent to calculate \frac{\Delta y}{\Delta x}.
Freefall
- In absence of air resistance, all objects fall with same acceleration: g = 9.8 \, \text{m/s}2 (acceleration of freefall).
- Weight W = mg, where g is gravitational field strength (N/kg).
- With air resistance: forces are weight (down) and air resistance (up).
- Air resistance increases with speed; when it equals weight, resultant force = 0 → terminal velocity.
- Skydiver: initially accelerates, then air resistance increases, eventually reaches terminal velocity; deploying parachute increases air resistance → deceleration to a lower terminal velocity.
- In a vacuum (no air resistance), objects never reach terminal velocity; they accelerate at g continuously.
Think like a scientist
- Measure a toy trolley's speed at different times as it moves down a low ramp.
- Comparison: the elapsed time after release. Outcome: the trolley's speed in metres per second.
- Control: use the same ramp angle and release point. Explain why this makes the comparison fairer.
- Evidence: Use a consistent method, repeated observations where appropriate and a table with labelled quantities and units. Keep unexpected results and investigate their cause.
- Safety: Practical activities need teacher supervision and an appropriate risk assessment. Use the provided data or simulation where the investigation specifies it.
- Inquiry task: State a testable question, predict the outcome using the science, then explain how your observations would support or challenge the prediction.
Evaluate the science
- Motion models help analyse transport and stopping distances.
- A straight graph fitted to a few points may hide changing acceleration; collect enough readings to test the model.
- Evaluation task: Link your conclusion to evidence, identify a limitation and suggest a specific improvement. Distinguish a measured result from an explanation of its cause.
슬라이드
연습 문제
무료 미리 보기 — 52개 중 8개 문제. 가입하면 전부 볼 수 있어요.
1.Which of the following is a scalar quantity?
Easy- Avelocity
- Bdisplacement
- Cacceleration
- Dspeed
2.What is the acceleration of free fall near Earth's surface?
Easy- A9.8 m/s
- B9.8 m/s²
- C9.8 m/s² downward
- D9.8 N/kg
3.On a distance-time graph, a horizontal line indicates that the object is:
Easy- Aaccelerating
- Bmoving at constant speed
- Cstationary
- Ddecelerating
4.Which of the following is the correct definition of velocity?
Easy- ADistance travelled per unit time
- BSpeed in a given direction
- CChange in displacement per unit time
- DRate of change of speed
5.The area under a speed-time graph represents:
Easy- Aacceleration
- Bvelocity
- Cdistance travelled
- Ddeceleration
6.An object accelerates from 4 m/s to 10 m/s in 3 s. What is its acceleration?
Medium- A2 m/s²
- B3 m/s²
- C4 m/s²
- D6 m/s²
7.On a speed-time graph, a straight line with negative gradient represents:
Easy- Aconstant acceleration
- Bconstant deceleration
- Cconstant speed
- Dincreasing acceleration
8.A skydiver falls from a plane. After reaching terminal velocity, the parachute opens. Which statement is correct?
Medium- AThe skydiver immediately stops falling.
- BThe skydiver accelerates upward.
- CThe skydiver decelerates to a lower terminal velocity.
- DThe skydiver continues at the same terminal velocity.
기출 문제
이 주제의 기출 문제 연습이 곧 나와요.
곧 출시