Real Life Graphs
플레이하며 배우기
이 문제들을 풀어 에너지를 얻은 뒤 낚시하고 탐험하세요. 계정이 필요 없어요.
교육자를 위해: Real Life Graphs(Maths [CIE], Core)을(를) 위한 바로 쓸 수 있는 수업 슬라이드, 복습 노트, 다이어그램 — 수업에 사용하거나, 학습자들이 실시간 게임으로 즐기는 인터랙티브 클래스 활동으로 진행하세요.
수업 노트
Conversion Graphs
- A conversion graph is a straight-line graph relating two quantities (e.g., currency, temperature).
- To convert from one quantity to the other, read across from the given value to the graph line, then read down/up to the other axis.
- The gradient of a conversion graph represents the rate of change (e.g., cost per kilometre).
- If the graph starts at the origin, you can use proportion to find values not on the axes.
- If the graph does not start at the origin, the y-intercept often represents a fixed cost (e.g., callout fee).
- Always check the scales on both axes carefully before reading values.
Conversion graph: mass to cost
Distance-Time Graphs
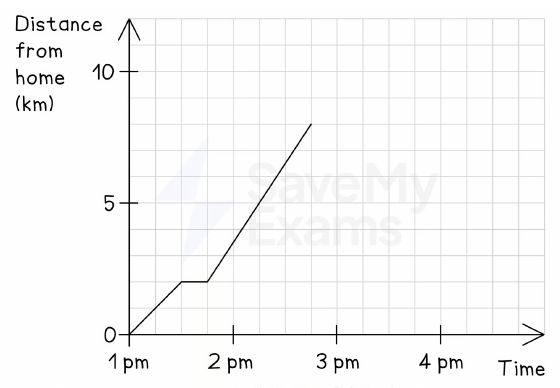
- A distance-time graph shows distance travelled (vertical axis) against time (horizontal axis).
- The gradient of the graph equals the speed (speed = distance ÷ time).
- A steeper line means a faster speed; a horizontal line means the object is stationary (rest).
- A line with positive gradient indicates moving away from the start; negative gradient indicates moving back towards the start.
- The overall average speed for a journey = total distance travelled ÷ total time (including rests).
- To find the distance at a given time, draw a vertical line to the graph then horizontal to the distance axis.
Mary's journey to her grandfather's house
Speed-Time Graphs
- A speed-time graph shows speed (vertical axis) against time (horizontal axis).
- A horizontal line means constant speed (if speed = 0, the object is at rest).
- A line with positive gradient means acceleration (speeding up); negative gradient means deceleration (slowing down).
- The area under a speed-time graph represents the distance travelled (not required at Core level but useful).
- Always check the vertical axis label to distinguish speed-time from distance-time graphs.
Speed–time graph
Interpreting Travel Graphs
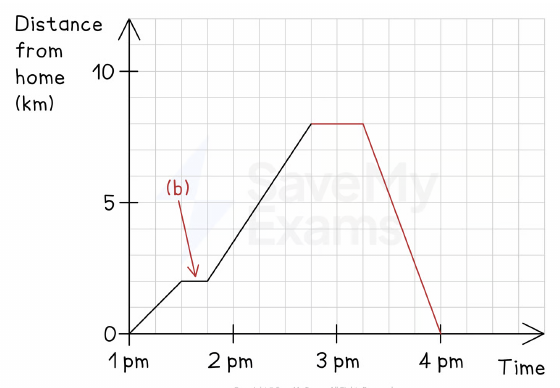
- A travel graph is a distance-time graph showing a journey with possible stops.
- A horizontal section indicates a stop (rest) – read the time duration from the time axis.
- To find the distance of a stop from home, read the distance at the horizontal section.
- To find arrival time, read the time at the final distance point.
- To complete a travel graph, add horizontal lines for stops and straight lines for travel at constant speed.
Mary's complete return journey
Calculating Speed from Graphs
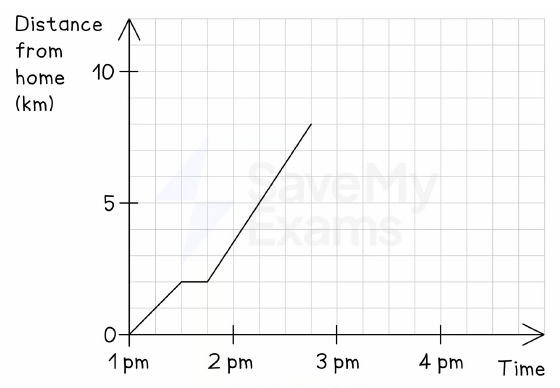
- Speed = gradient = (change in distance) ÷ (change in time).
- Use a straight section of the graph to calculate speed (rise over run).
- If the graph has multiple sections, calculate speed separately for each.
- For a return journey, the gradient is negative but the speed is the absolute value of the gradient.
- Example: A line from (1:45, 2 km) to (2:45, 8 km) has gradient (8-2)/(1) = 6 km/h.
Mary's journey to her grandfather's house
Using Conversion Graphs with Fixed Charges
- Some conversion graphs do not pass through the origin – the y-intercept is a fixed charge (e.g., callout fee).
- To find the fixed charge, read the value on the y-axis when x = 0.
- The gradient then represents the cost per unit (e.g., per hour or per km).
- To find the equation of the line: c = gradient × d + fixed charge.
- Example: A plumber charges £45 callout plus £60 per hour → c = 60t + 45.
Plumber's charge graph
Comparing Two Linear Graphs
- When comparing two services (e.g., taxis), plot both lines on the same axes.
- The point of intersection shows where the costs are equal.
- For distances less than the intersection, the cheaper service is the one with the lower y-intercept.
- For distances greater than the intersection, the cheaper service is the one with the lower gradient.
- Always state which is cheaper for a given distance using the graph.
Comparing two taxi services
Completing Travel Graphs
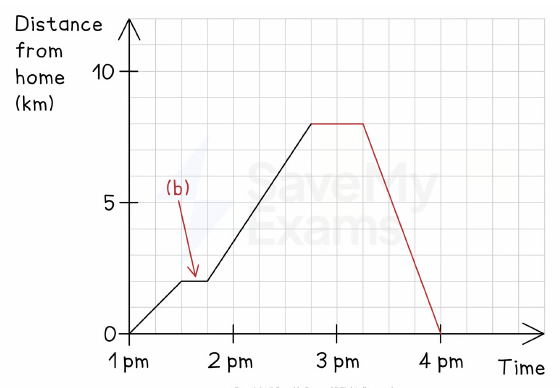
- To complete a travel graph, first add any stops as horizontal lines for the correct duration.
- For travel at constant speed, draw a straight line from the end of the stop to the destination at the correct time.
- The gradient of the return line should match the speed given (use rise/run to check).
- Ensure the graph is continuous and labelled with time and distance as required.
Mary's complete return journey
슬라이드
연습 문제
무료 미리 보기 — 56개 중 8개 문제. 가입하면 전부 볼 수 있어요.
1.What does the gradient of a distance-time graph represent?
Easy- ASpeed
- BDistance
- CTime
- DAcceleration
2.On a distance-time graph, a horizontal line indicates that the object is:
Easy- AStationary
- BMoving at constant speed
- CAccelerating
- DDecelerating
3.What does the gradient of a conversion graph represent?
Easy- ARate of change
- BFixed cost
- CTotal cost
- DInitial value
4.A conversion graph shows the cost of a taxi journey. The y-intercept is £5. What does this represent?
Easy- AFixed charge
- BCost per mile
- CTotal cost for 1 mile
- DDistance travelled
5.In a distance-time graph, a steeper line means:
Easy- AFaster speed
- BSlower speed
- CLonger time
- DShorter distance
6.A car travels 120 km in 2 hours. What is its average speed in km/h?
Easy- A60 km/h
- B240 km/h
- C30 km/h
- D120 km/h
7.A journey consists of 3 parts: 2 hours at 50 km/h, then 1 hour rest, then 1 hour at 30 km/h. What is the total distance travelled?
Medium- A130 km
- B160 km
- C100 km
- D80 km
8.On a speed-time graph, a horizontal line at 20 m/s for 10 seconds means the object travels:
Easy- A200 m
- B20 m
- C2 m
- D0.5 m
기출 문제
이 주제의 기출 문제 연습이 곧 나와요.
곧 출시