Populations & Communities
Học bằng cách chơi
Trả lời những câu hỏi này để kiếm năng lượng, rồi câu cá và khám phá. Không cần tài khoản.
Ghi chú bài học
Populations in Ecosystems
- A population is a group of organisms of the same species living in an area at one time.
- Members of a population interact with each other and can breed together.
- A population can be isolated from other populations of the same species due to living in a different area.
- Isolation means that members of separate populations cannot breed together and gene exchange cannot take place between them.
- Populations interact with their abiotic environment to form an ecosystem.
Estimating Population Size
- Sampling involves measuring small samples of a population that act to represent the whole population.
- Random sampling selects sampling points at random, avoiding bias by the person carrying out the sampling.
- Systematic sampling places sampling points at fixed intervals, avoiding accidentally missing out sections of habitat.
- A transect is a line along which samples are taken, often used to investigate the effect of environmental features on species distribution.
- A sampling error is the difference between an estimated population size and the true population size.
- Sampling error can be minimised by good investigation design, e.g. carrying out the right type of sampling and taking a large enough sample size.
Random quadrat sampling
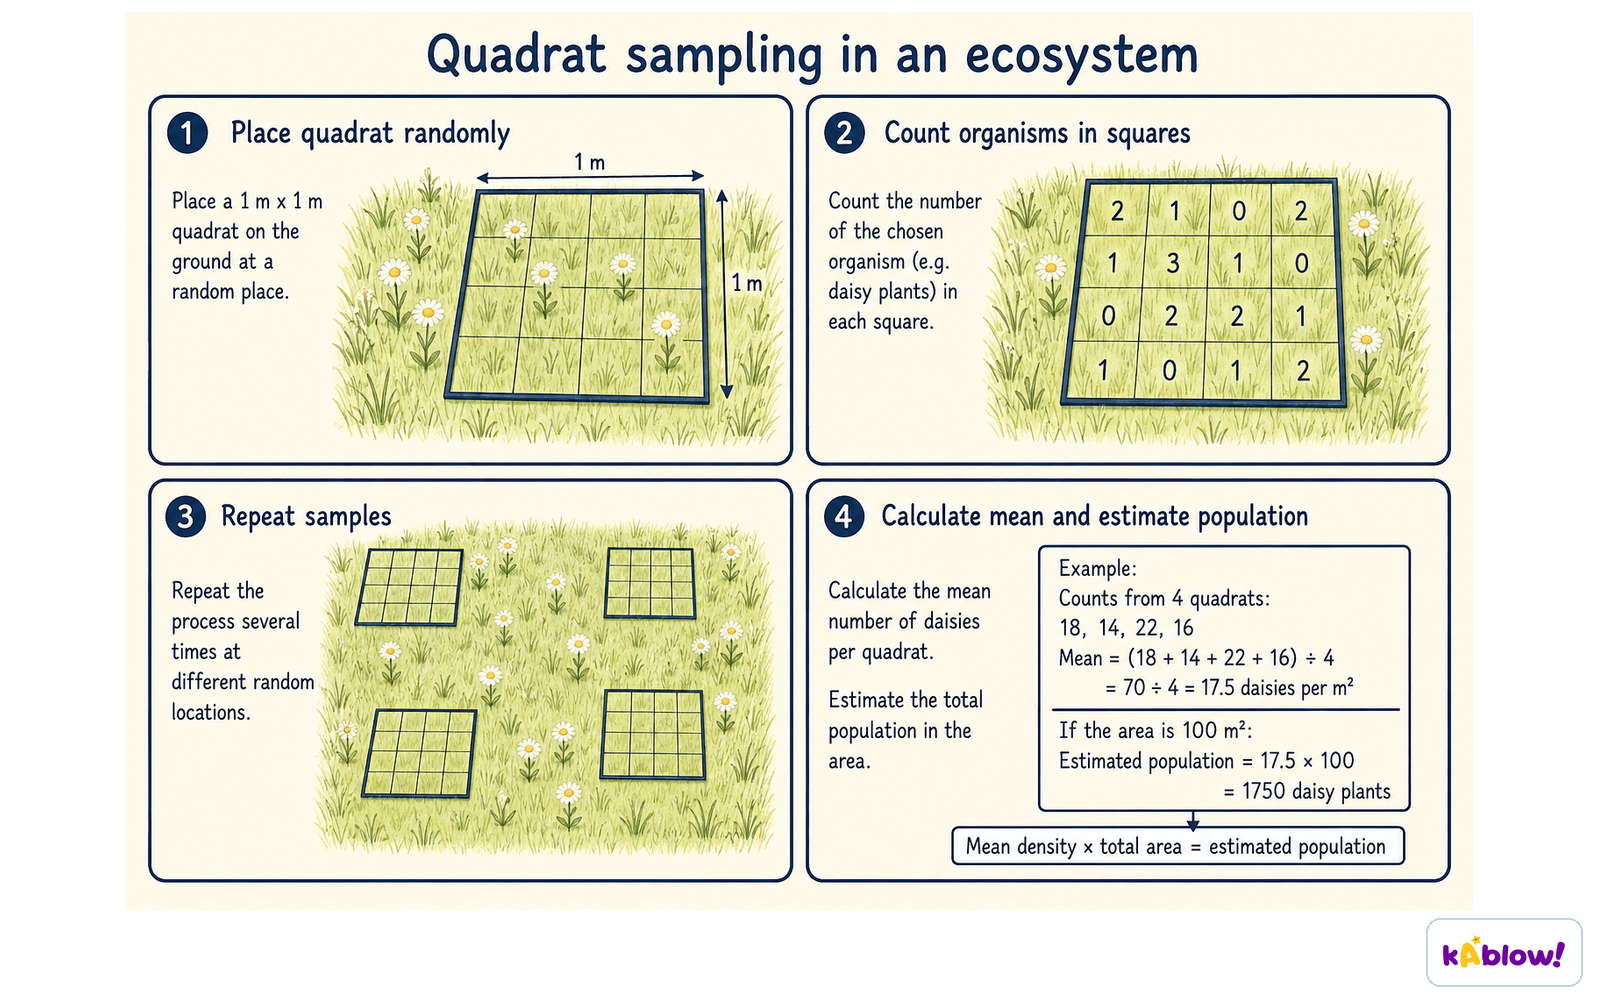
Random Quadrat Sampling
- A frame quadrat is a square frame placed within the area to be studied to provide a sample.
- Quadrats are used to study the distribution of sessile organisms.
- Quadrats can be different sizes depending on the species being studied, e.g. 1 m² for small organisms and 400 m² for large organisms such as trees.
- Frame quadrats can be placed randomly, e.g. using random co-ordinates, or systematically, e.g. along a transect.
- Data recorded from a frame quadrat can include presence or absence, species frequency, species abundance (ACFOR scale), and percentage cover.
- Quadrats can be divided into smaller squares to allow percentage cover to be assessed more easily.
Estimating Population Size: Motile Organisms
- The mark-release-recapture method is used for motile organisms.
- The first large sample is taken; as many individuals as possible are caught, counted and marked in a way that won’t affect their survival.
- The marked individuals are returned to their habitat and allowed to randomly mix with the rest of the population.
- After a sufficient time period, a second large sample is captured and the number of marked and unmarked individuals is counted.
- The Lincoln index is used to estimate population size: Population size = (M × N) / R, where M = number marked in first sample, N = total number in second sample, R = number of marked individuals recaptured.
- The Lincoln index assumes that marked individuals disperse and mix fully, marking doesn't affect survival, marking remains visible, and the population size stays the same during the study period.
Limiting Population Size
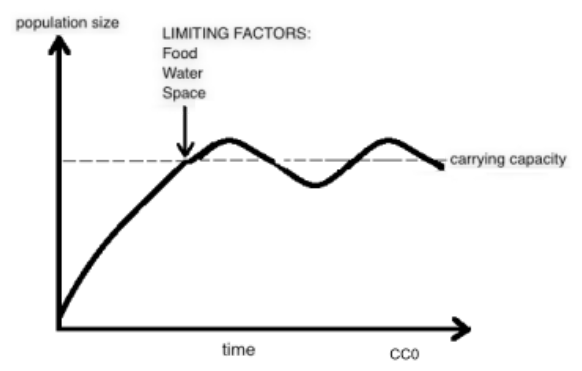
- Carrying capacity is the maximum number of individuals of a species that an ecosystem can support, represented by the letter K.
- Abiotic factors that affect carrying capacity include light availability, temperature, and soil mineral availability.
- Biotic factors that affect carrying capacity include competition for resources, predation, and disease.
- Density-dependent factors have a different effect at different population densities, e.g. pathogens, competition, and predation have a greater effect at high densities.
- Density-independent factors have the same effect on a population at any population density, e.g. a natural disaster such as a flood.
- Density-dependent factors tend to act to keep a population at or below its carrying capacity; this is a negative feedback effect.
- A population controlled by positive feedback will respond to a change in population size by continuing to change in the same direction.
Carrying capacity
Limiting Population Size: Examples
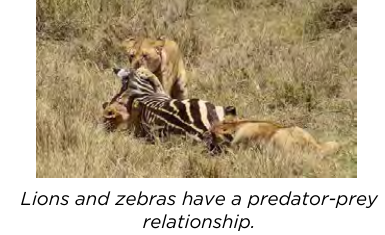
- Predators are consumers that kill and eat other animals; the animals that are eaten are prey.
- In a stable community, predator and prey population sizes rise and fall in a predator-prey cycle that limits the population sizes of both.
- In a predator-prey cycle: the number of predators increases when there is more prey available; the number of prey decreases in response to an increase in predators; the number of predators decreases in response to a decrease in prey; the number of prey increases in response to a decrease in predators.
- The relationship between the Canada lynx and the snowshoe hare is a famous example of the predator-prey interaction.
- Populations can be controlled by top-down control (limited by predators) or bottom-up control (limited by availability of resources).
- A population that is limited by predators is controlled by a top-down control, e.g. snowshoe hare limited by lynx, or plant populations limited by herbivory.
- A population that is limited by the availability of resources is controlled by a bottom-up control, e.g. lynx limited by prey availability, or plant populations limited by light intensity.
Allelopathy & Antibiotic Secretion
- Interspecific competition occurs when species compete with each other for resources.
- Some species have strategies that increase their ability to outcompete other species, e.g. camouflage increases survival chances, while secretion of harmful chemicals decreases the survival chances of a competitor.
- Harmful chemicals secreted into the environment are known as secondary metabolites (as opposed to primary metabolites, which are essential for survival).
- Allelopathy is a strategy that involves damaging the survival of a competing species.
- Organisms that carry out allelopathy secrete secondary metabolites that harm other organisms into their surroundings, e.g. plants may secrete harmful chemicals via roots into the soil, release harmful gases via stomata, or store harmful chemicals in leaves that are released when leaves fall and break down.
- Examples of plant species that carry out allelopathy include garlic mustard (produces sinigrin), bracken ferns (release toxins into soil), and Himalayan balsam (secretes allelochemicals into soil).
- Antibiotic secretion in some bacteria is a well-known example of allelopathy; antibiotics kill bacteria by preventing cell wall formation or inhibiting protein synthesis, reducing interspecific competition.
Population Growth Curves: Skills
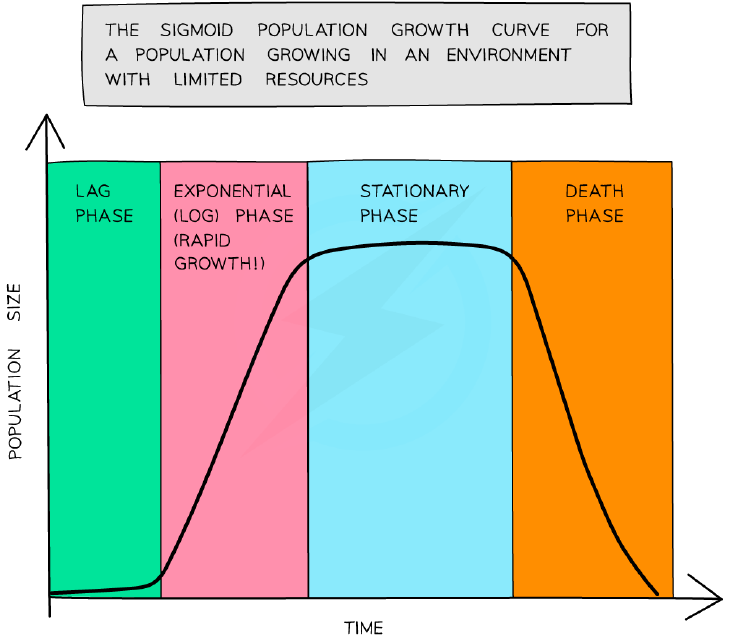
- Populations of living organisms tend to follow a set growth pattern over time, giving rise to a population growth curve.
- A sigmoid (s-shaped) growth curve contains three phases: exponential phase, transition phase, and plateau phase.
- Exponential phase (logarithmic phase): no factors limit population growth, so the population increases exponentially; the number of individuals increases, and so does the rate of growth.
- Transition phase: limiting factors start to act on the population, e.g. competition increases and predators are attracted to large prey populations; the rate of growth slows, though the population is still increasing.
- Plateau phase (stationary phase): limiting factors cause the death rate to equal the birth rate and population growth stops; this plateau occurs at the carrying capacity.
- Population growth is exponential when the speed of growth is proportional to the number of individuals, i.e. a population of 20 individuals will reproduce at twice the rate of a population of 10 individuals.
- An exponentially growing population plotted with a log scale on the y axis will appear as a straight line.
- Organisms such as yeast and duckweed can be used to model the sigmoid population growth curve under laboratory conditions.
The sigmoid population growth curve
Populations: Intraspecific Relationships
- Intraspecific relationships involve interactions between individuals of the same species ('intra' = within).
- Intraspecific relationships can involve cooperation (both members benefit) or competition (one member outcompetes the other).
- Intraspecific cooperation examples include orcas working together to catch prey, meerkats dividing roles, and ants working together to build nests and provide food.
- Individuals of the same species have the same needs, so they frequently compete for the same resources.
- Plants compete with members of the same species for light, minerals, water, and space.
- Animals compete with members of the same species for food, mates, and territory.
- Examples of intraspecific competition include male red deer fighting for access to females, robins defending territory aggressively, and oak trees competing for light, water, and minerals.
A predator-prey relationship
Community: Interspecific Relationships
- A community is multiple populations of different species living and interacting in the same area.
- Communities include populations from all groups of living organisms, e.g. plants, animals, fungi, and bacteria.
- Living communities interact with their abiotic environment to form an ecosystem.
- Interspecific relationships are interactions between different species within a community ('inter' = between).
- Types of interspecific interaction include herbivory, predation, interspecific competition, mutualism, parasitism, and pathogenicity.
- Mutualism occurs between members of different species; both members benefit, e.g. bacteria in root nodules, mycorrhizal relationships between fungi and plants, and coral polyps and algae.
- In root nodules (e.g. in Fabaceae), bacteria convert nitrogen gas into ammonia, which is then converted into nitrates; the bacteria gain carbohydrates from the plant.
- Mycorrhizae are relationships between plant roots and fungi; fungal hyphae increase surface area for water and mineral ion absorption, and the fungi receive organic compounds such as glucose.
Slide
Sign up free to view the lesson slides
Step through every slide for this topic — plus flashcards and revision notes — with a free account.
Câu hỏi luyện tập
Xem trước miễn phí — 8 trên 60 câu hỏi. Đăng ký để xem tất cả.
1.What is the definition of a population?
Easy- AA group of organisms of the same species living in an area at one time
- BAll the organisms living in a habitat together with their non-living environment
- CMultiple populations of different species living and interacting in the same area
- DAll the living organisms in a habitat
2.What is the definition of a community?
Easy- AA group of organisms of the same species living in an area at one time
- BMultiple populations of different species living and interacting in the same area
- CAll the organisms living in a habitat together with their non-living environment
- DThe non-living parts of an ecosystem
3.What is the definition of an ecosystem?
Easy- AA group of organisms of the same species living in an area at one time
- BMultiple populations of different species living and interacting in the same area
- CA community of living organisms interacting with their non-living environment
- DThe physical environment in which organisms live
4.Which of the following is an abiotic factor?
Easy- APredation
- BCompetition
- CDisease
- DLight availability
5.Which of the following is a biotic factor?
Easy- ATemperature
- BCompetition for resources
- CSoil mineral availability
- DLight availability
6.Which of the following statements about quadrat sampling to determine population size are correct? I. Random sampling avoids bias. II. Random sample sites can be selected by throwing a quadrat with eyes closed. III. Quadrat sampling is only useful for small organisms.
Easy- AI only
- BI and II only
- CI and III only
- DI, II, and III
7.Which of the following correctly describes a population?
Easy- AAll of the organisms living in a habitat, together with their living and non-living interactions.
- BAll of the small birds living in a habitat.
- CAll of the blue tits living in a habitat.
- DAll of the living organisms in a habitat.
8.Which of the following statements about the mark-release-recapture method is correct?
Medium- AMarked individuals must be allowed to randomly mix with the rest of the population before taking a second sample.
- BAny marking method can be used to mark organisms in the first sample.
- CPopulation size can be estimated using quadrat sampling.
- DSimpson's index is used to calculate population size.
Unlock all 60 questions & more
Tạo tài khoản miễn phí để xem mọi câu hỏi, slide, thẻ ghi nhớ và ghi chú ôn tập cho chủ đề này.