Real Life Graphs
Học bằng cách chơi
Trả lời những câu hỏi này để kiếm năng lượng, rồi câu cá và khám phá. Không cần tài khoản.
Ghi chú bài học
Conversion Graphs
- A conversion graph is a straight-line graph used to convert between two quantities (e.g., °C to °F, currency, litres to gallons).
- The gradient represents the rate of change (e.g., cost per mile on a taxi fare graph).
- To convert a value, draw a vertical/horizontal line to the graph, then read off the other axis.
- If the graph starts at the origin, you can use proportion to find values not on the axes.
- If the graph does not start at the origin (e.g., fixed callout fee), the y-intercept represents the fixed cost.
- Always double-check the scales on both axes before reading values.
Conversion graph: mass to cost
Distance-Time Graphs
- Distance-time graphs show distance on the vertical axis and time on the horizontal axis.
- The gradient of the graph equals the speed (speed = distance/time).
- A steeper line means faster speed; a horizontal line means the object is stationary.
- A line with positive gradient indicates moving away from the start; negative gradient indicates moving back towards the start.
- Overall average speed = total distance travelled ÷ total time (including rests).
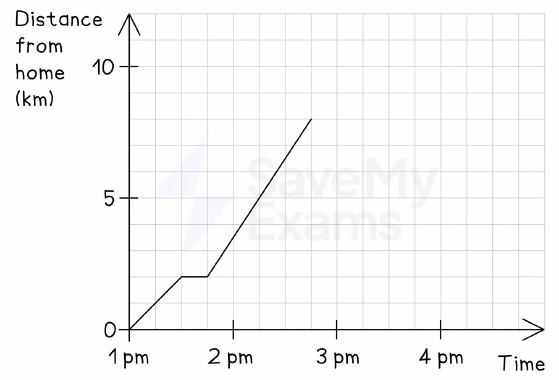
- To complete a journey graph, add a horizontal line for rests and a straight line (with appropriate gradient) for return trips.
Mary's journey to her grandfather's house
Speed-Time Graphs
- Speed-time graphs show speed on the vertical axis and time on the horizontal axis.
- The gradient equals acceleration (acceleration = speed/time). Positive gradient = speeding up; negative gradient = deceleration.
- A horizontal line indicates constant speed (if speed = 0, the object is at rest).
- Distance travelled is the area under the graph – split into rectangles and triangles to calculate.
- For a curved graph, draw a tangent at a point to find instantaneous acceleration.
- Always check the vertical axis to distinguish speed-time from distance-time graphs.
Speed–time graph
Rates-of-Change Graphs
- Rates-of-change graphs show how one variable changes with respect to another (often time).
- The gradient of the graph gives the rate of change (e.g., litres per kilometre, cm³ per second).
- A constant gradient means a constant rate of change; a horizontal line means zero rate of change.
- For a curve, draw a tangent to estimate the rate of change at a specific point.
- The units of the gradient are the y-axis units divided by the x-axis units.
- In filling containers, the shape of the depth-time graph reflects the container's width: narrow parts give steeper gradients (faster depth increase).
Rate of change from a curve
Slide
Sign up free to view the lesson slides
Step through every slide for this topic — plus flashcards and revision notes — with a free account.
Câu hỏi luyện tập
Xem trước miễn phí — 8 trên 37 câu hỏi. Đăng ký để xem tất cả.
1.On a conversion graph, the gradient represents:
Easy- Athe rate of change between the two quantities
- Bthe total amount of the first quantity
- Cthe starting value of the second quantity
- Dthe difference between the two quantities
2.In a speed-time graph, a horizontal line represents:
Easy- Aconstant speed
- Bacceleration
- Cdeceleration
- Drest
3.The distance travelled by an object is equal to the area under which type of graph?
Easy- Aspeed-time graph
- Bdistance-time graph
- Cacceleration-time graph
- Dconversion graph
4.On a distance-time graph, a horizontal line indicates:
Easy- Athe object is stationary
- Bthe object is moving at constant speed
- Cthe object is accelerating
- Dthe object has returned to the start
5.The gradient of a distance-time graph gives the:
Easy- Aspeed
- Bacceleration
- Cdistance
- Dtime
6.A car travels at 20 m/s for 15 seconds, then decelerates at 2.5 m/s² until it stops. Find the total distance travelled.
Medium- A380 m
- B300 m
- C450 m
- D500 m
7.The speed-time graph shows a car accelerating from rest to 20 m/s in 10 seconds, then travelling at constant speed for 20 seconds, then decelerating to rest in 10 seconds. What is the total distance travelled?
Medium- A600 m
- B500 m
- C700 m
- D400 m
8.Using a conversion graph, if 10 kg costs $6, what is the cost of 35 kg?
Medium- A$21
- B$18
- C$24
- D$30
Unlock all 37 questions & more
Tạo tài khoản miễn phí để xem mọi câu hỏi, slide, thẻ ghi nhớ và ghi chú ôn tập cho chủ đề này.