Statistical Diagrams
Học bằng cách chơi
Trả lời những câu hỏi này để kiếm năng lượng, rồi câu cá và khám phá. Không cần tài khoản.
Ghi chú bài học
Stem & Leaf Diagrams
- A stem-and-leaf diagram displays an ordered list of data using digits; two-digit numbers split into tens (stem) and units (leaf).
- Stem written vertically, leaves written horizontally in order; include a key showing how values are formed (e.g., 1|8 means 18).
- To find the median, cross out numbers from ends until middle is reached; if two remain, find midpoint.
- Common mistake: writing only the leaf (e.g., 6) instead of stem+leaf (e.g., 26) for median.
Bar Charts & Pictograms
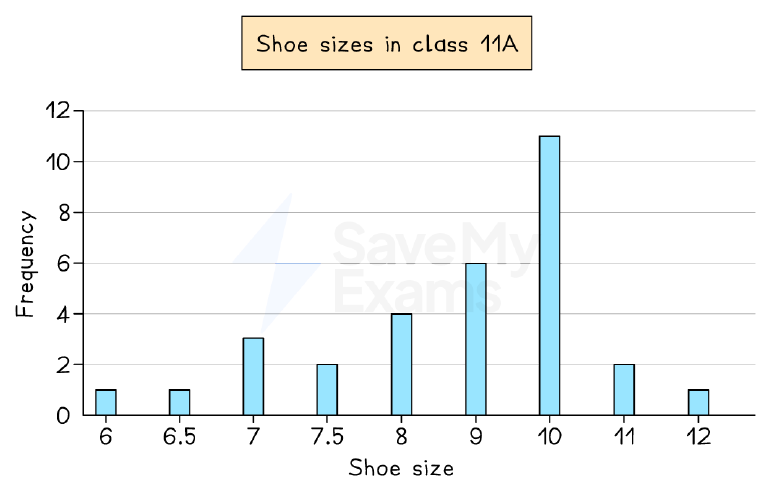
- A bar chart displays discrete data with bars of equal width separated by gaps; height shows frequency.
- The mode is the outcome with the highest bar; dual bar charts compare two data sets side-by-side.
- A pictogram uses symbols to represent frequency; a key shows value of one symbol (e.g., 1 shoe = 2 students).
- Half or quarter symbols are used; to find median from bar chart, convert to table and use averages from tables method.
Bar chart: shoe sizes in class 11A
Pie Charts
- A pie chart is a circle divided into sectors showing relative proportions; angles are proportional to frequencies.
- To draw: find total frequency, calculate each sector angle as (frequency/total) × 360°, then draw using protractor.
- If chart says 'not to scale', use ratio/proportion; e.g., if 30° = 15 people, then 1° = 0.5 people.
- Total frequency corresponds to 360°; sector angle = (category frequency / total frequency) × 360°.
Pie chart: favourite colours (30 students)
Reading & Interpreting Statistical Diagrams
- Read context, keys, axis labels, and units carefully; note any outliers or anomalies.
- Describe trends using numbers from graph (e.g., 'temperature decreased from 12°C to 9°C').
- Use exact wording from question; calculate mode, median, mean, or range to support explanations.
- Consider limitations: small data set, bias, or scope (e.g., Jan-Mar data cannot predict August).
Garden temperature at 7am each day
Comparing Statistical Diagrams
- Compare trends (increases, decreases, peaks), steepness, and differences/similarities using numbers.
- Calculate mean or median to compare averages; calculate range to compare spread.
- Always relate calculations back to context; e.g., 'male range = 5, female range = 4, so males vary more'.
- Be cautious: data may be unrepresentative (e.g., opening week of a shop) – state reasons.
Comparing books bought by male and female customers
Slide
Sign up free to view the lesson slides
Step through every slide for this topic — plus flashcards and revision notes — with a free account.
Câu hỏi luyện tập
Xem trước miễn phí — 8 trên 40 câu hỏi. Đăng ký để xem tất cả.
1.In a stem-and-leaf diagram, the number 47 is represented as 4 | 7. What does the '4' represent?
Easy- AThe tens digit
- BThe units digit
- CThe value 4
- DThe key
2.In a stem-and-leaf diagram, what is the purpose of the key?
Easy- ATo show how to read the stem and leaves
- BTo unlock the diagram
- CTo indicate the total frequency
- DTo label the axes
3.A bar chart shows the favourite colours of students. The bar for 'Blue' is the tallest. Which average can be identified from this?
Easy- AMode
- BMedian
- CMean
- DRange
4.In a pictogram, one symbol represents 4 people. How many symbols are needed to represent 10 people?
Easy- A2.5
- B2
- C3
- D2.5 symbols
5.A pie chart shows the favourite sports of 40 students. The sector for football has an angle of 90°. How many students chose football?
Easy- A10
- B20
- C15
- D12
6.The stem-and-leaf diagram shows blood pressure reductions (mmHg) for 11 patients. Key: 1|2 means 12 mmHg. Stem: 1 | 2 6 7 8 9, 2 | 1 3 4, 3 | 1 4, 4 | 0. What is the median reduction?
Medium- A21
- B22
- C23
- D24
7.A dual bar chart compares the number of pets owned by Year 7 and Year 8 students. The Year 7 bar for 1 pet has height 10, and the Year 8 bar has height 8. How many more Year 7 students have 1 pet than Year 8?
Easy- A2
- B18
- C10
- D8
8.In a pie chart, the sector angle for a category is 72°. The total frequency is 60. What is the frequency of that category?
Easy- A12
- B15
- C20
- D10
Unlock all 40 questions & more
Tạo tài khoản miễn phí để xem mọi câu hỏi, slide, thẻ ghi nhớ và ghi chú ôn tập cho chủ đề này.