Photosynthesis
邊玩邊學
回答這些題目賺取能量,接著就能釣魚、探索。不需要帳號。
課程筆記
The Process of Photosynthesis
- Photosynthesis converts simple inorganic compounds into complex organic compounds using light energy.
- It is a form of energy conversion: light energy is transformed into chemical energy stored in biomass.
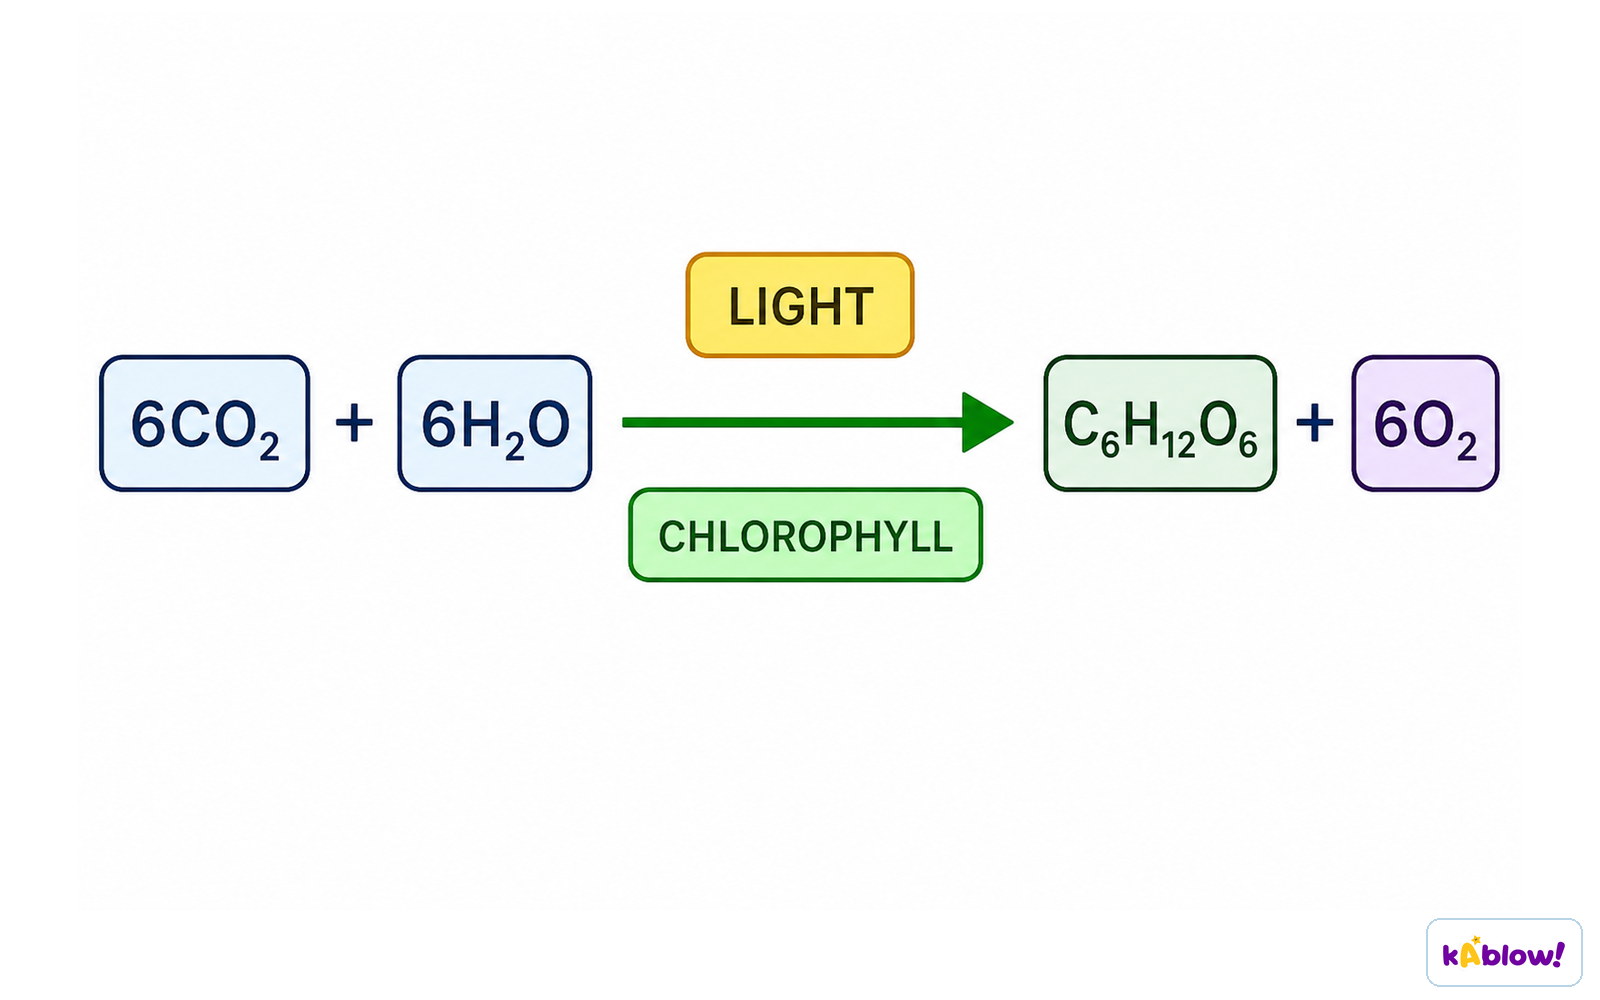
- The reactants are carbon dioxide and water; the products are glucose and oxygen.
- Carbon dioxide is converted to glucose using hydrogen released when a water molecule is split.
- Oxygen is released as a waste product from the water-splitting process.
- Photosynthesis occurs in autotrophic organisms such as plants, algae and cyanobacteria.
- The glucose and oxygen formed are the reactants of aerobic cell respiration, while the carbon dioxide and water released during respiration are used as reactants of photosynthesis.
Balanced equation for photosynthesis
Photosynthetic Pigments
- Plants contain several different photosynthetic pigments which absorb different wavelengths of light.
- There are two groups of pigments: chlorophylls and carotenoids.
- Chlorophyll a is blue-green and chlorophyll b is yellow-green.
- β carotene is orange and xanthophyll is yellow.
- Chlorophylls absorb wavelengths in the blue-violet and red regions of the light spectrum.
- They reflect green light, which is why plants usually appear green.
- Carotenoids absorb wavelengths of light mainly in the blue-violet region of the spectrum.
- Carotenoids surround the chlorophyll and absorb both similar and different wavelengths of light, expanding the range of wavelengths that can be absorbed for use in photosynthesis.
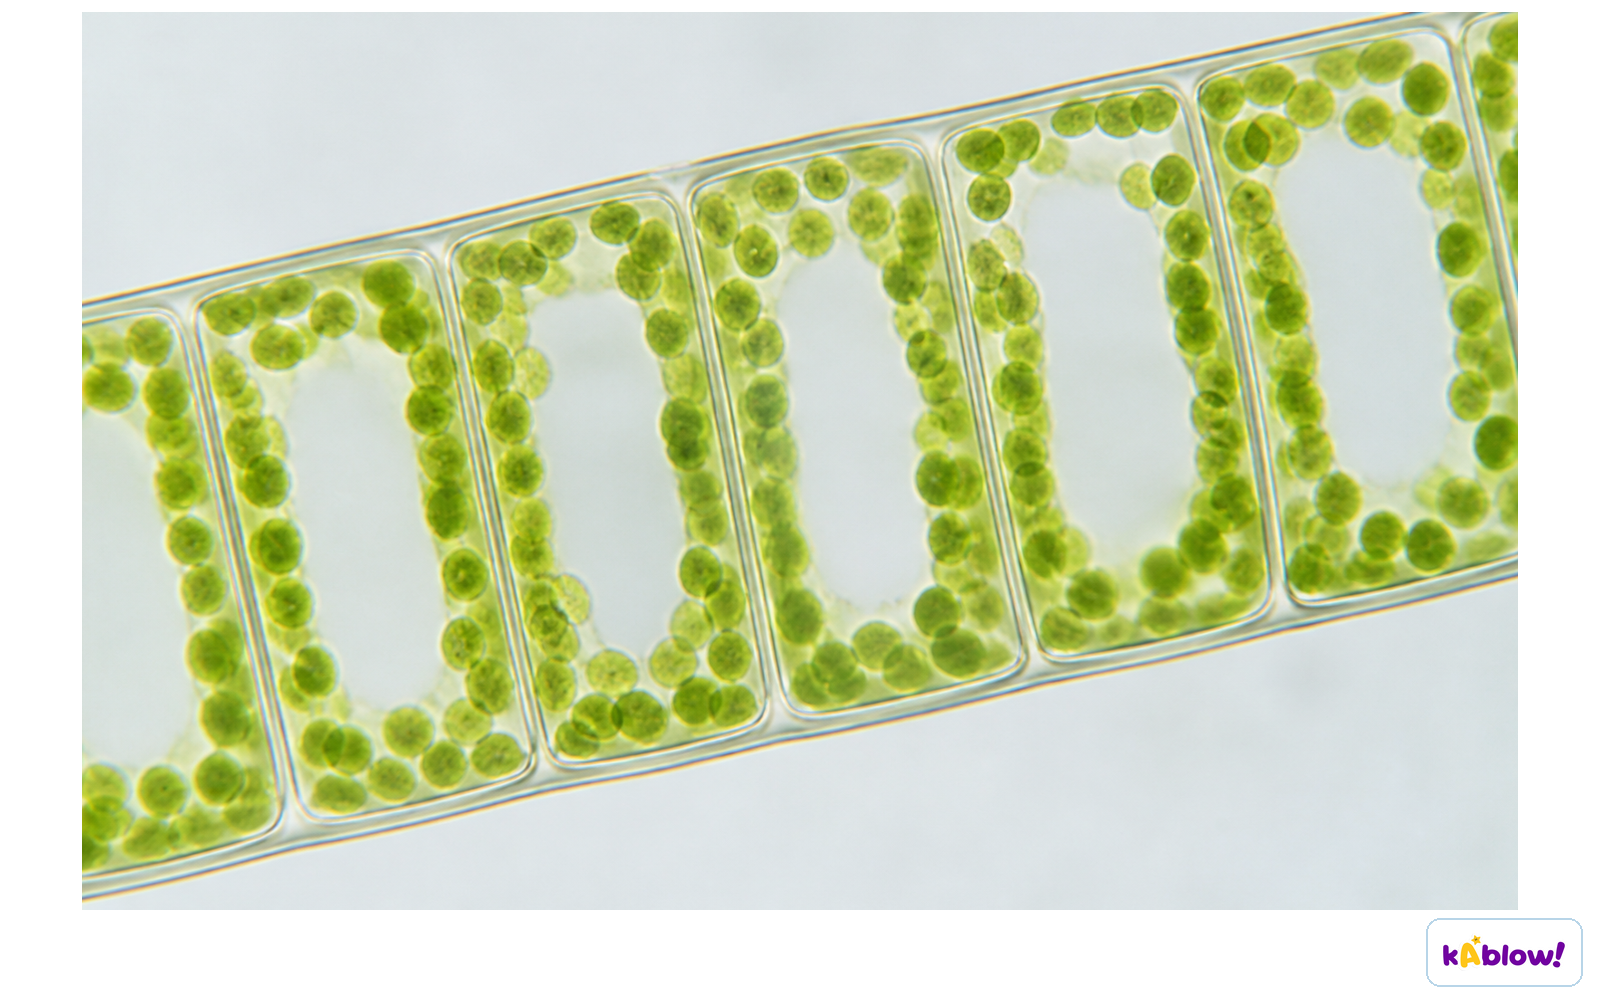
Chlorophyll within chloroplasts
Separating Photosynthetic Pigments: Skills
- Chromatography is an experimental technique used to separate mixtures, as different components travel through the material at different speeds.
- Paper chromatography passes the pigment mixture through paper (cellulose); thin-layer chromatography (TLC) passes it through a thin layer of adsorbent such as silica gel, giving faster and more distinct separation.
- A retardation factor (Rf value) can be calculated for each component of the mixture.
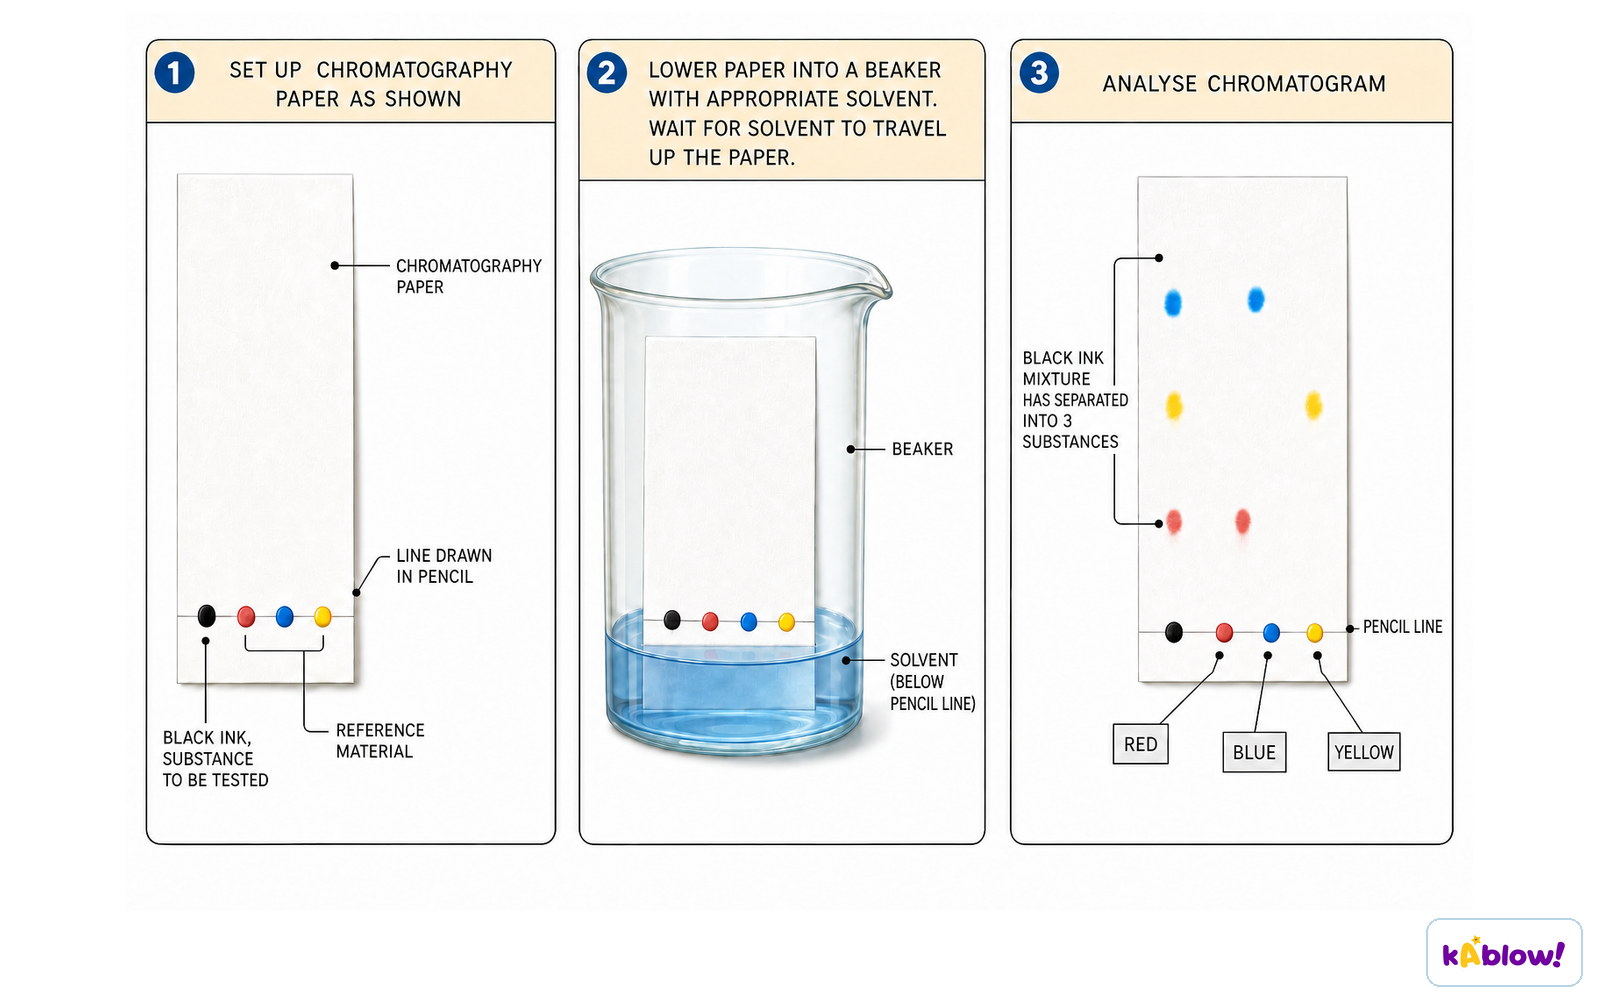
- In the method, a pencil line is drawn about 1 cm above the bottom of the filter paper; pen must not be used as the ink will separate into pigments and obscure the results.
- A healthy leaf that has been in direct sunlight is cut and ground in a mortar with about 20 drops of propanone to release the pigments.
- Propanone is an organic solvent, so fats such as the lipid membrane dissolve in it; the combination of propanone and mechanical pressure breaks down the cell and chloroplasts.
- The pigment is spotted onto the centre of the pencil line using a capillary tube, and the paper is suspended in the chromatography solvent with the solvent level below the pencil line.
- The mixture dissolves in the solvent (the mobile phase) and passes through the static material (the stationary phase); the solvent front is marked in pencil and the Rf value calculated for each spot, always measuring to the centre of each spot.
Paper chromatography
Chromatography Results and Limitations
- Chromatography can separate and identify chloroplast pigments because each pigment has a unique Rf value.
- The Rf value shows how far a dissolved pigment travels through the stationary phase.
- Molecules with a higher affinity to the stationary phase, such as large molecules, travel slower and have a smaller Rf value.
- Molecules that are more soluble in the mobile phase travel faster and have a larger Rf value.
- In general, carotenoids have the highest Rf values (usually close to 1), chlorophyll b has a much lower Rf value, and chlorophyll a has an Rf value between those of carotenoids and chlorophyll b.
- Small Rf values indicate the pigment is less soluble and/or larger in size.
- Paper chromatography is not as specific as other chromatography techniques; it does not give data on the amount of each pigment present or the wavelengths they absorb, which can be found using colorimetry.
Absorption Spectra
- Light is made up of a mixture of all the visible wavelengths: red, orange, yellow, green, blue, indigo and violet.
- An absorption spectrum is a graph showing the absorbance of different wavelengths of light by a particular pigment in the chlorophyll.
- Within the chlorophyll, light energy results in the excitation of electrons, triggering electron transfer and a series of reactions that make up photosynthesis.
- During photosynthesis, light energy is transformed to chemical energy when glucose is formed.
- The chemical structure of pigment molecules determines the wavelengths of light that can be absorbed.
- The green part of the spectrum is largely reflected from the leaf, which is why leaves usually appear green.
Absorption and Action Spectra: Skills
- An action spectrum is a graph showing the rate of photosynthesis at different wavelengths of light.
- The rate of photosynthesis is highest at the blue-violet and red regions of the light spectrum, as these are the wavelengths chlorophylls and carotenoids can absorb.
- There is a strong correlation between the cumulative absorption spectra of all pigments and the action spectrum.
- Both graphs have two main peaks, at the blue-violet and red regions, supporting the idea that the most light energy is absorbed at these wavelengths, leading to the fastest rate of photosynthesis.
- Both graphs have a trough in the green-yellow region, supporting the idea that the least light energy is absorbed there, leading to the slowest rate of photosynthesis.
- The rate of photosynthesis can be determined by measuring the volume of oxygen produced or the carbon dioxide consumed at different wavelengths of light.
- In such an experiment, the lamp is kept the same distance from the pondweed; different colour filters are placed in front of the lamp, and an experiment with no filter investigates white light.
- When drawing an action spectrum: label the x-axis wavelength in nm from 400 to 700 (marking 500 and 600), use a percentage scale on the y-axis, draw a smooth curve with peaks at either end and a trough in the middle for green light.
Limiting Factors of Photosynthesis: Skills
- An aquatic plant such as Elodea or Cabomba is a good choice for investigating photosynthesis because the rate can be measured by counting oxygen bubbles released from a cutting.
- Oxygen output from terrestrial plants would not be observable.
- A hypothesis is a proposed explanation for an idea which may be true or false, and can be tested through observations or experiments to provide support or opposition.
- The independent variable is the factor deliberately manipulated between a specific range; the dependent variable is the factor measured during the experiment.
- All other variables must be controlled so that the independent variable is the only factor affecting the dependent variable.
- Light intensity, carbon dioxide concentration and temperature are all limiting factors that affect the rate of photosynthesis and can be altered experimentally.
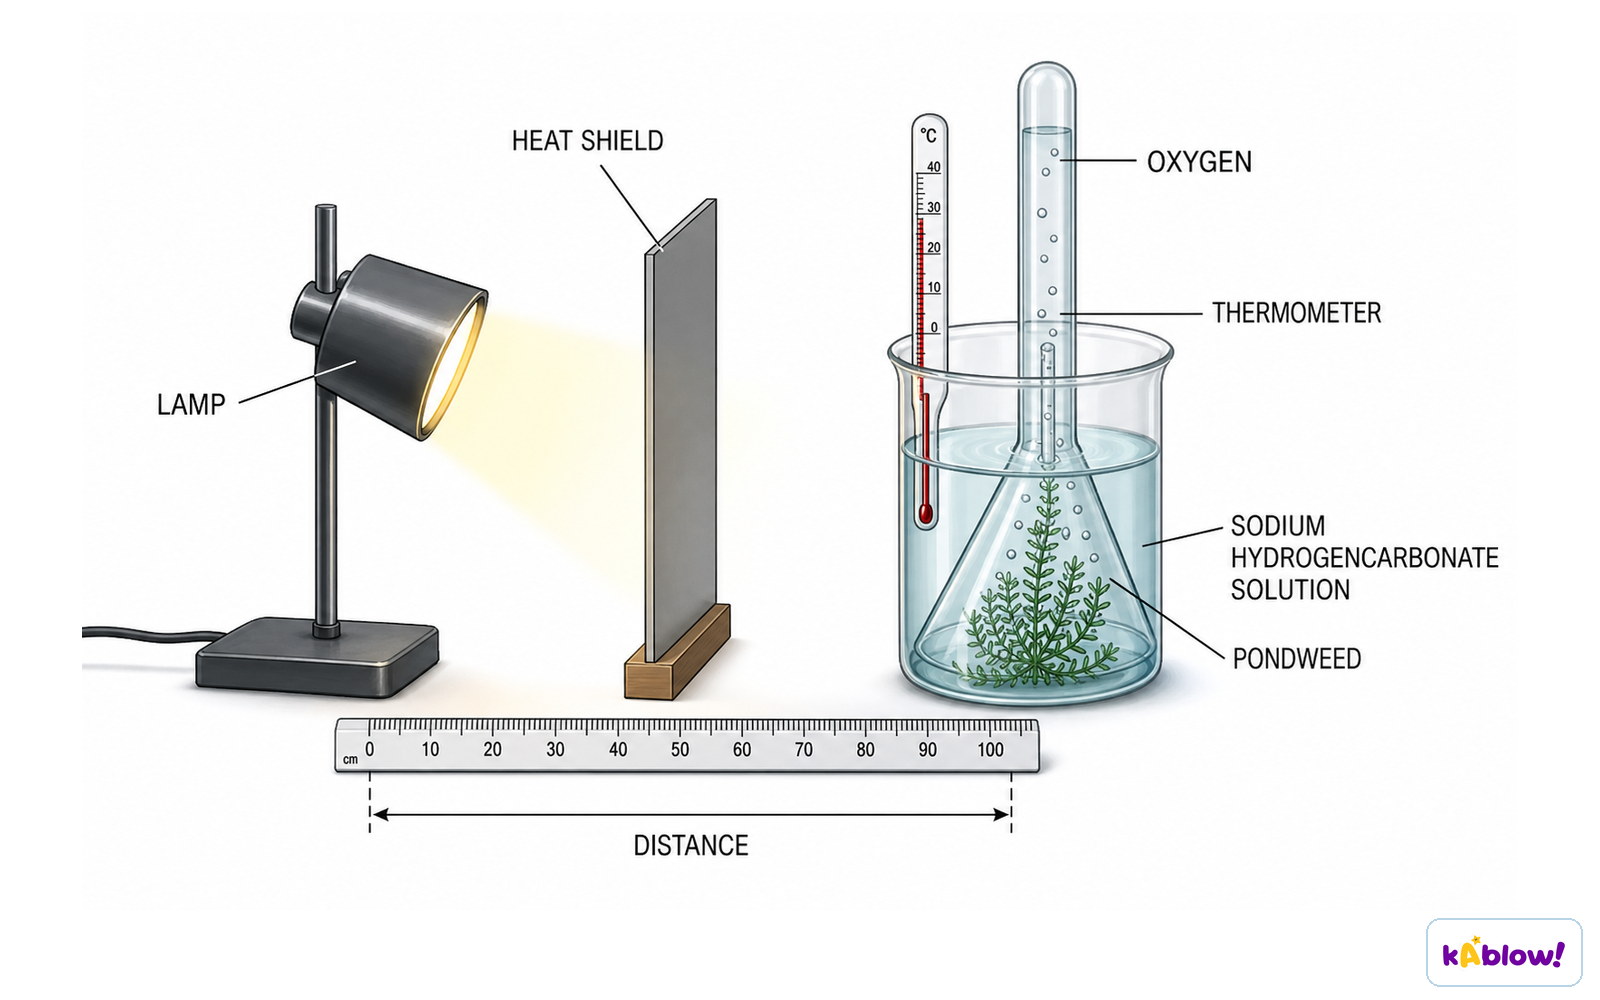
Investigating light intensity
Investigating Limiting Factors: Experimental Design
- Basic setup: an aquatic plant cutting in water with powdered sodium hydrogencarbonate (NaHCO3), a glass funnel, a boiling tube, a lamp for illumination and a glass tank filled with water.
- Research question example: does the rate of photosynthesis (number of bubbles released per minute) of Elodea increase as light intensity increases?
- Method: place the aquatic plant in a beaker of water, place a lamp a set distance from the plant, record the number of bubbles observed in three minutes, and repeat for different distances between the lamp and plant.
- Improvements include using a gas syringe to collect and measure the volume of gas produced, repeating the experiment at least twice for each distance and calculating the mean, and using a data logger to measure results continuously.
- Temperature is controlled by the glass tank of water absorbing heat emitted from the lamp, or by using modern LED bulbs which give off less heat than filament bulbs.
- Carbon dioxide concentration is controlled by boiling and re-cooling the water to remove dissolved carbon dioxide, then adding a set mass of sodium hydrogencarbonate to make the concentration approximately 0.1 mol dm-3 so it is not limiting.
Effects of Light Intensity, Carbon Dioxide and Temperature
- As light intensity increases, the rate of photosynthesis increases (positive correlation); at this stage light intensity is the limiting factor.
- At some point there is no further increase in the rate of photosynthesis if light intensity is increased; now temperature or carbon dioxide concentration may be limiting factors.
- For carbon dioxide concentration, successive masses of sodium hydrogencarbonate are added in increments of 0.01 mol dm-3, temperature is kept constant at 25°C using a water bath, and light intensity is kept constant by keeping the lamp at a fixed distance.
- The graph of carbon dioxide concentration against rate of photosynthesis shows a similar trend to that observed with light intensity.
- For temperature, the rate is measured from 5°C to 50°C using water baths, with sodium hydrogencarbonate at a fixed concentration of 0.1 mol dm-3 and the lamp at a fixed distance.
- An increase in temperature increases the rate of photosynthesis due to increased kinetic energy of enzyme and substrate molecules, resulting in more collisions and formation of more enzyme-substrate complexes.
- This increase continues until the optimum temperature for the enzyme is reached; any further increase causes the rate to decrease as enzymes begin to denature and cannot form enzyme-substrate complexes.
Carbon Dioxide Enrichment Experiments
- Future rates of photosynthesis and plant growth can be predicted using enclosed greenhouse experiments and free air carbon dioxide enrichment experiments (FACE).
- Rising levels of greenhouse gases, including carbon dioxide, make it fundamental to study the effect of carbon dioxide on plant growth and photosynthesis to understand potential future risks.
- Enclosed greenhouse experiments use an enclosed greenhouse or polytunnel, allowing variables to be manipulated or controlled to establish the impact of different factors.
- Only small species that can be contained in a greenhouse can be studied using this method.
- Variables that might be manipulated include light, carbon dioxide, temperature and wavelengths of light, while other variables are controlled so only one variable is considered at a time.
- FACE experiments are carried out in natural ecosystems where carbon dioxide is pumped into the area to increase localised carbon dioxide concentrations, allowing larger plants and trees to be studied.
- In FACE experiments other variables cannot be controlled but can be monitored to establish any relationships that may become apparent in the data.
- In any experiment, a variable is any factor that could change or be changed; the independent variable is the only one changed, controlled/confounding variables must be controlled or monitored, and the dependent variable is measured to determine the outcome.
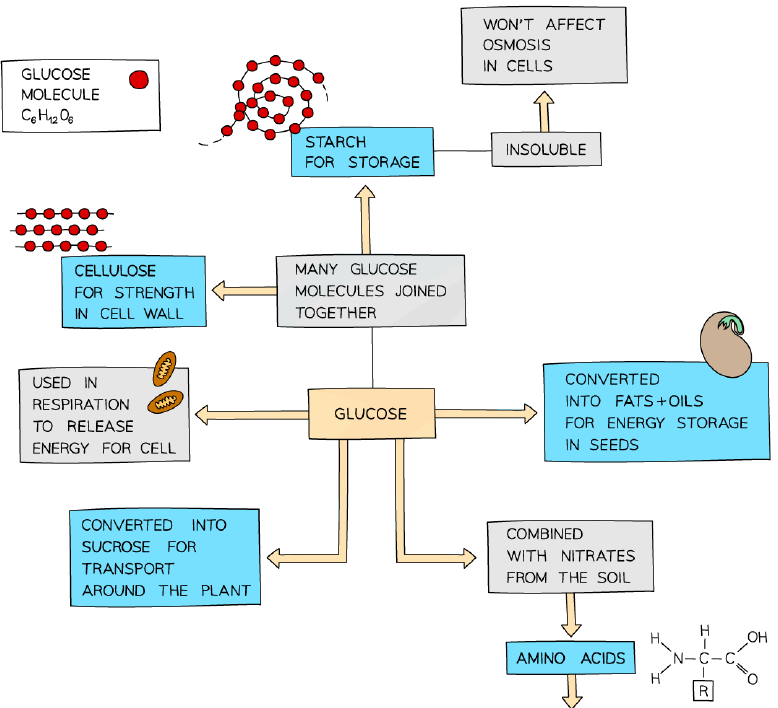
The fate of glucose in a plant
投影片
練習題
免費預覽——61 題中的 8 題。註冊即可查看全部。
1.Which option correctly completes the sentence below? Photosynthesis is an example of _________.
Easy- AAn exothermic reaction.
- BA catabolic reaction.
- CAn endothermic reaction.
- DNet energy loss.
2.A plant is grown in increasing concentrations of carbon dioxide, whilst other factors are kept constant. What will happen to the rate of photosynthesis?
Medium- AThere will be no change.
- BIt will increase to a maximum level.
- CIt will keep increasing exponentially.
- DIt will increase to an optimal level and then decrease.
3.With reference to an experimental set-up using pondweed, which option correctly describes how the rate of photosynthesis can be directly measured?
Easy- AMeasuring the distance between the light and plant.
- BMeasuring the change in biomass of the plant.
- CMeasuring the carbon dioxide production by counting bubbles.
- DMeasuring the oxygen production by counting bubbles.
4.Which of the following statements about photosynthesis is incorrect?
Medium- AEnergy captured from sunlight is used to fix carbon.
- BPhotosynthesis is an anabolic reaction.
- CPhotosynthesis only occurs in chloroplasts.
- DPhotosynthesis is an endothermic reaction.
5.Paper chromatography can be used to separate photosynthetic pigments obtained from chloroplasts. The chromatography strip shows distinct coloured pigment bands. Which pigments are represented by the bands with the highest Rf values?
Medium- ACarotenes and Xanthophylls.
- BCarotenes and Chlorophyll a.
- CCarotenes.
- DChlorophyll a and Chlorophyll b.
6.Which is the most correct statement about chlorophyll?
Medium- AAbsorbs red and blue light.
- BReflects red and blue light, and absorbs green light.
- CAbsorbs the full spectrum of light equally.
- DOnly absorbs blue light.
7.A plant is grown in standard atmospheric air with a carbon dioxide concentration of approximately 400 ppm. The level of carbon dioxide is then reduced to below 100 ppm. Which of the following statements about the plant are correct? 1. The rate of photosynthesis increases. 2. Respiration and growth continue until stored sugars are used up. 3. The rate of photosynthesis decreases. 4. Metabolism is reduced to save energy.
Medium- AI only
- BI and II
- CII and III
- DII, III and IV
8.The following graphs show the absorption spectrum for chlorophyll a and the action spectrum showing the relative rate of photosynthesis at different wavelengths of light. Why do the graphs look different?
Medium- AOther pigments are involved in photosynthesis which can absorb light of different wavelengths.
- BOnly visible light is absorbed by photosynthetic pigments.
- CPhotosynthesis can only occur in blue and red wavelengths of light.
- DChlorophyll a inhibits the absorption of green and yellow light.