Global climate change
邊玩邊學
回答這些題目賺取能量,接著就能釣魚、探索。不需要帳號。
課程筆記
The Greenhouse Effect
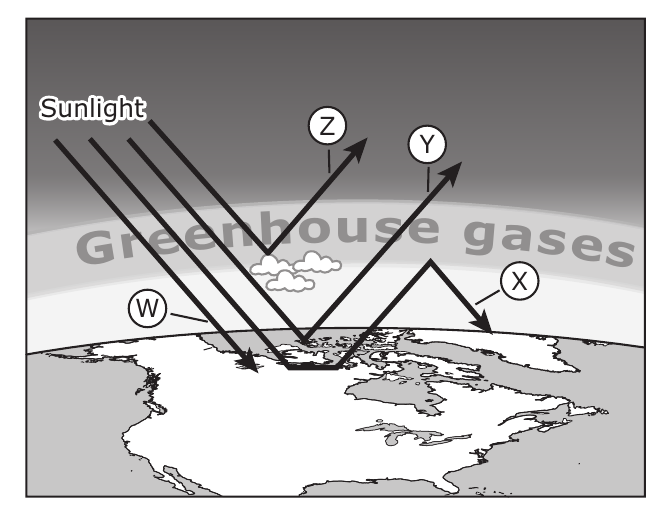
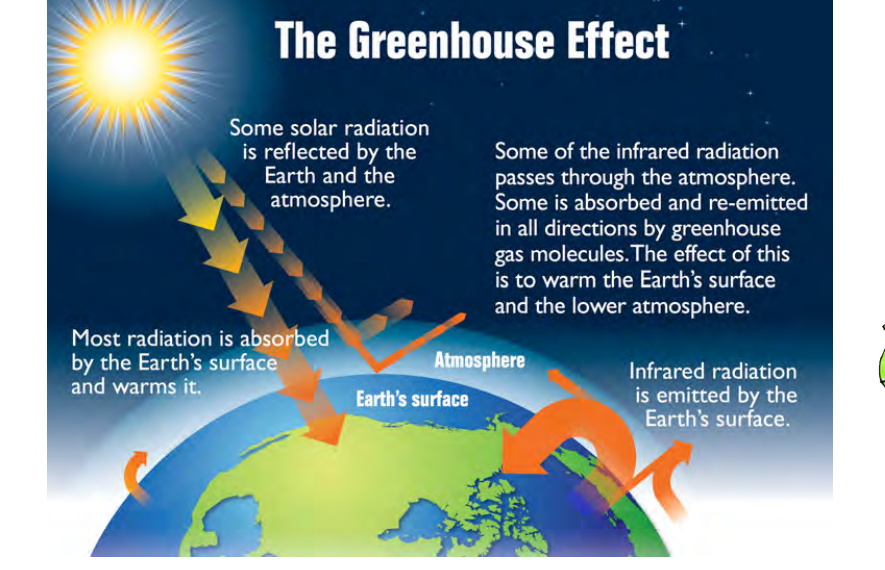
- The greenhouse effect is the natural warming of Earth's atmosphere: greenhouse gases let sunlight in but trap some of the heat that would otherwise escape to space, acting like a blanket around the planet.
- Greenhouse gases include carbon dioxide (CO2), water vapor (H2O), methane (CH4), ozone (O3), and nitrous oxides — together less than 1% of the atmosphere, which is otherwise mostly nitrogen and oxygen.
- Carbon dioxide comes from respiration, volcanic eruptions and the decomposition of plant material; methane comes from decomposition and from digestion in animals such as livestock; nitrous oxide is produced by bacteria.
- Without the greenhouse effect, Earth's average surface temperature would be about -18°C (0°F), too cold for life as we know it; with it, the average is about 15°C (59°F).
- About 30% of incoming solar radiation is reflected straight back to space; the rest is absorbed as heat, and some of what the surface then radiates outward is trapped again by greenhouse gases.
The greenhouse effect: sunlight reaching Earth's surface and infrared radiation being absorbed and re-emitted by greenhouse gases
Earth's Energy Balance
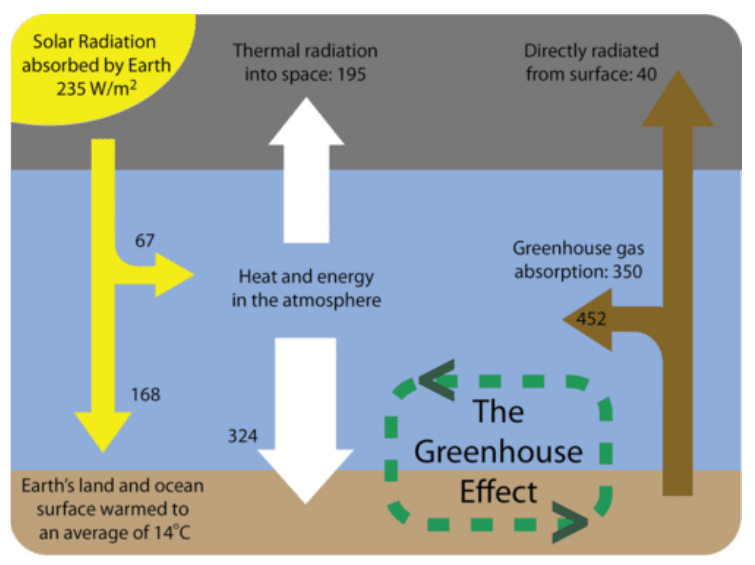
- The diagram's numbers are in watts per square metre (W/m²), a measure of how much energy flows in or out of the atmosphere.
- Of the solar radiation Earth absorbs (235 W/m²), some heats the atmosphere directly and some heats the surface; some of that energy radiates straight out to space (195 W/m²) without being trapped.
- Earth's surface itself emits thermal radiation; most of it (350 W/m²) is absorbed by greenhouse gases rather than escaping directly, and much of that absorbed energy (452 W/m²) is sent back down to warm the surface again.
- This balance between incoming and outgoing energy keeps Earth's land and ocean surface at an average of about 14°C.
Diagram of Earth's energy balance, showing solar radiation absorbed, thermal radiation into space, and greenhouse gas absorption in watts per square metre
Comparing Earth, Venus and Mars
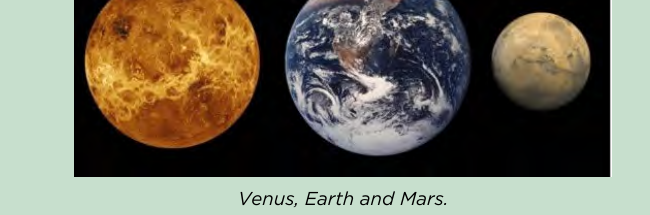
- Venus, Earth and Mars all have atmospheres, but very different amounts of carbon dioxide and very different surface temperatures.
- Venus: atmosphere about 92 times Earth's surface pressure and 96.5% CO2 — an extreme greenhouse effect gives an average surface temperature of about 462°C, the hottest planet in the solar system.
- Mars: atmosphere less than 1% of Earth's surface pressure, even though it is about 95% CO2 — too thin to trap much heat, so the average surface temperature is about -55°C.
- Earth: about 78% nitrogen, 21% oxygen and only 0.03% CO2 — just enough greenhouse effect to keep the planet at a temperature that supports life.
- Comparing the three shows it is the amount of a greenhouse gas in an atmosphere, not just its presence, that determines how strong the greenhouse effect is.
Venus, Earth and Mars
Human Causes of Global Climate Change
- Global climate change is a long-term, worldwide change in climate — average temperature and weather patterns — unlike normal day-to-day or year-to-year weather.
- Since the Industrial Revolution, burning fossil fuels (coal, oil and gas) for energy has released large additional amounts of CO2 into the atmosphere.
- Other human activities add greenhouse gases too: growing rice and raising livestock release methane, and clearing land removes vegetation that would otherwise absorb CO2 through photosynthesis.
- Natural factors — changes in solar radiation, volcanic activity — also affect climate, but scientists confirm the recent rapid rise in global temperature is due mainly to human activity, not natural variation.
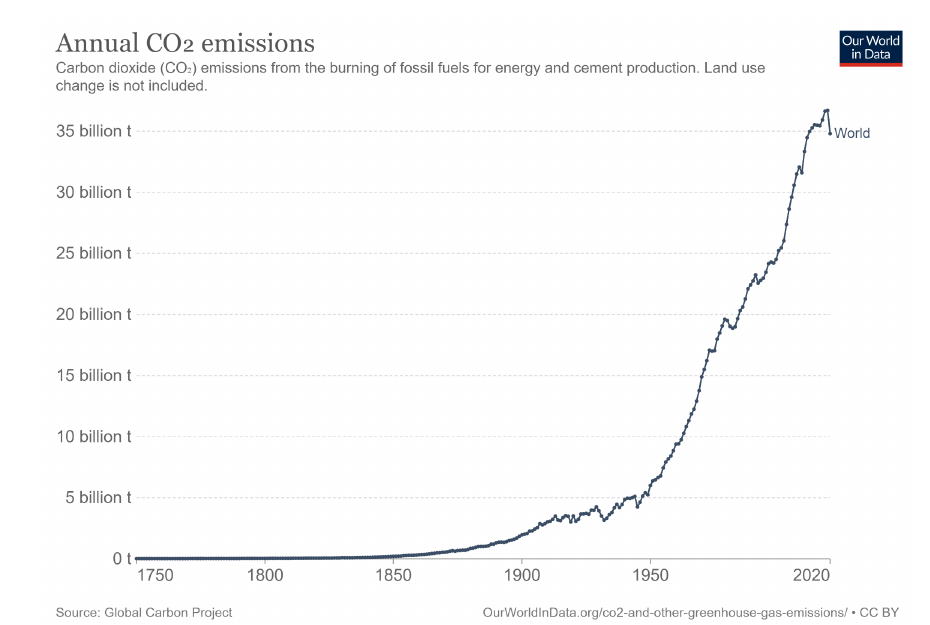
- Global annual CO2 emissions from burning fossil fuels have risen from almost nothing in 1850 to more than 35 billion tonnes a year by 2020.
Annual global CO2 emissions from burning fossil fuels for energy and cement production, 1750-2020
Evidence: Rising Carbon Dioxide
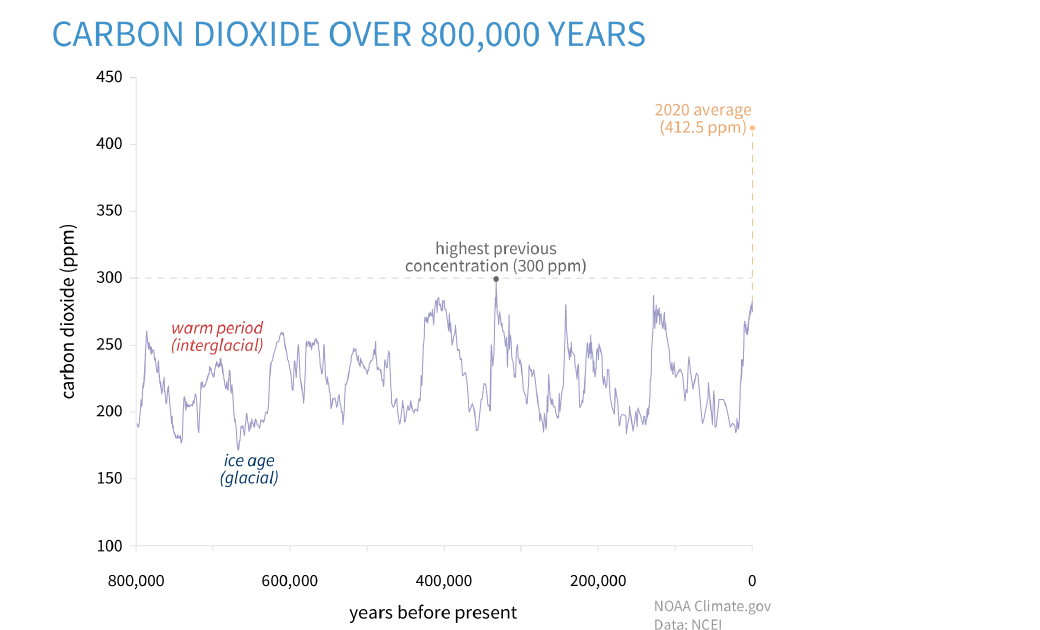
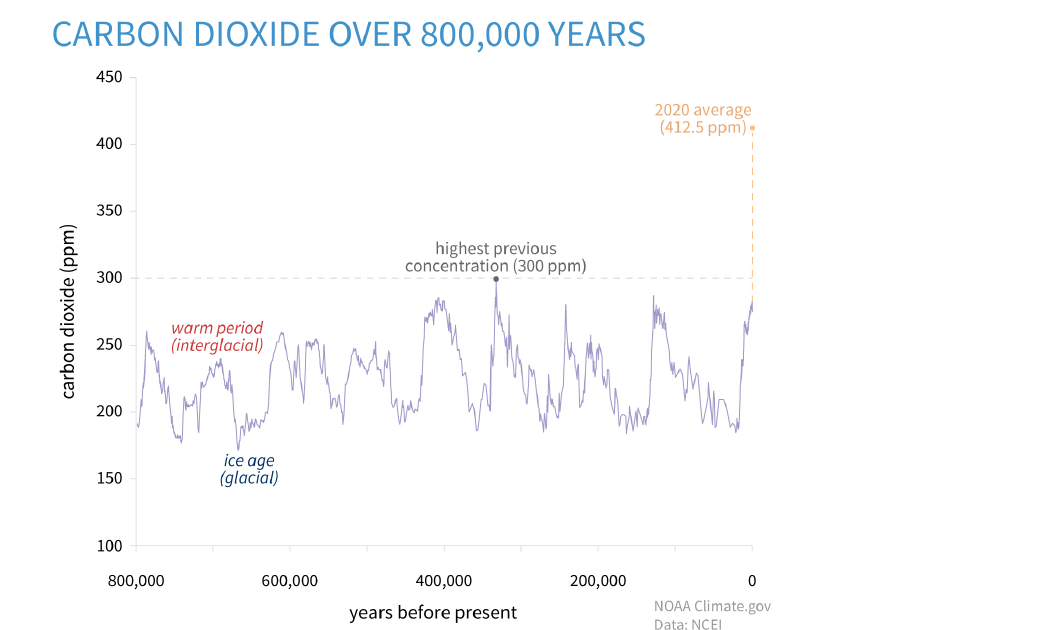
- Air bubbles trapped in Antarctic ice let scientists measure CO2 levels going back 800,000 years; over that time CO2 cycled naturally between about 180 ppm (ice ages) and a highest previous level of about 300 ppm (warm interglacial periods).
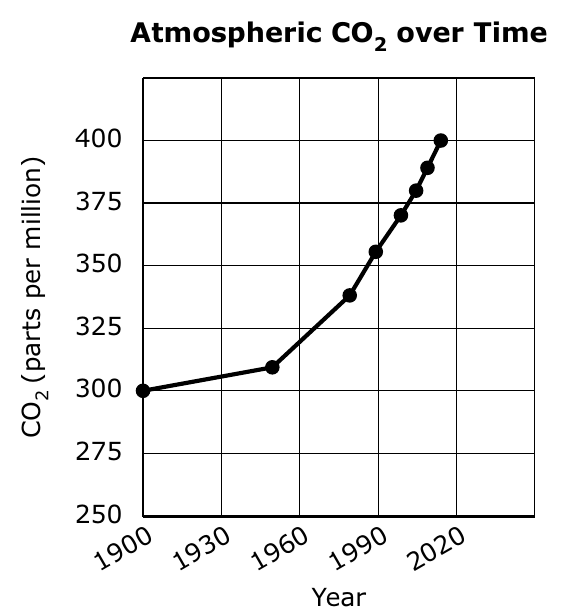
- By 2020 the global average CO2 concentration had reached about 412.5 ppm — far above any level in that 800,000-year record.
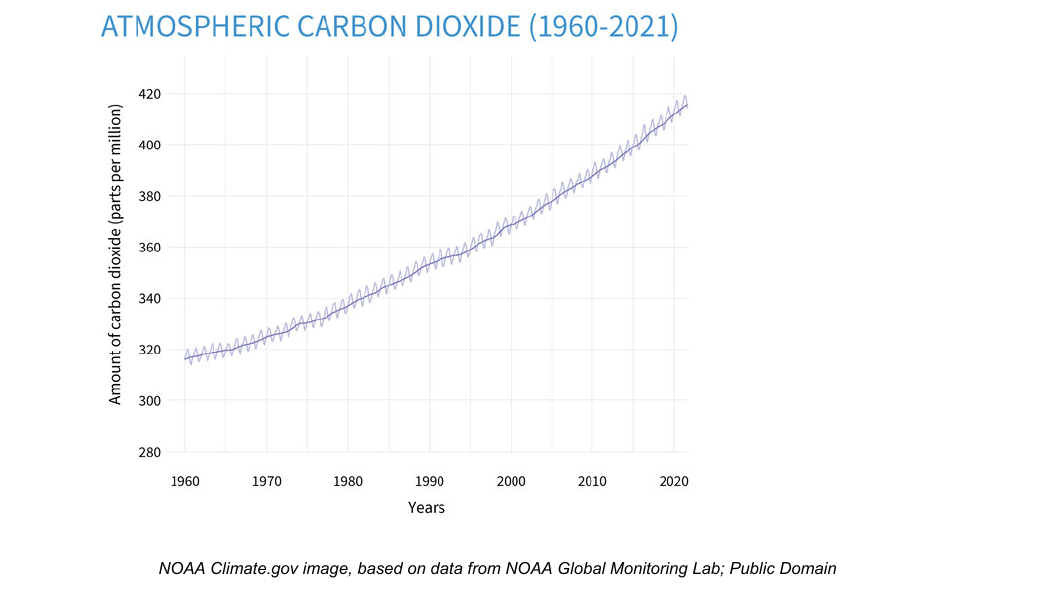
- Direct instrument measurements since 1960 show CO2 climbing every single year, from roughly 316 ppm in 1960 to over 415 ppm by 2020.
- This rise does not match the pattern of natural ice-age cycles; it matches the timeline of industrial fossil-fuel burning.
Carbon dioxide over 800,000 years, with the 2020 average (412.5 ppm) and the highest previous concentration (300 ppm) marked
Evidence from Ice Cores
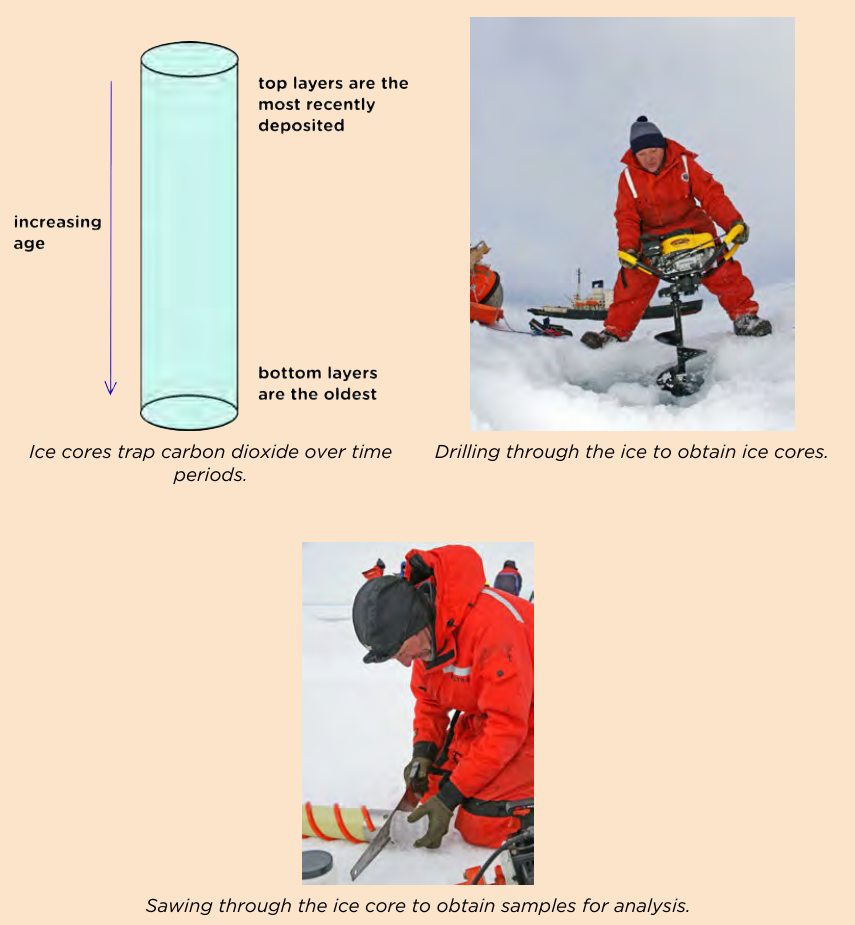
- Ice cores are cylinders drilled from polar ice; the deepest ice is the oldest, and each layer traps tiny bubbles of the air present when it froze.
- Analysis of one Antarctic ice core (covering the last 160,000 years) shows CO2 levels varying naturally between about 180 and 280 ppm.
- Current CO2 levels are over 387 ppm in that same dataset — far higher than any natural value in the ice-core record.
- Ice cores are one of the main lines of evidence that today's CO2 levels are unusual compared with the recent geological past.
Ice-core diagram and photographs of drilling and sawing an ice core for CO2 analysis
Effects of Climate Change
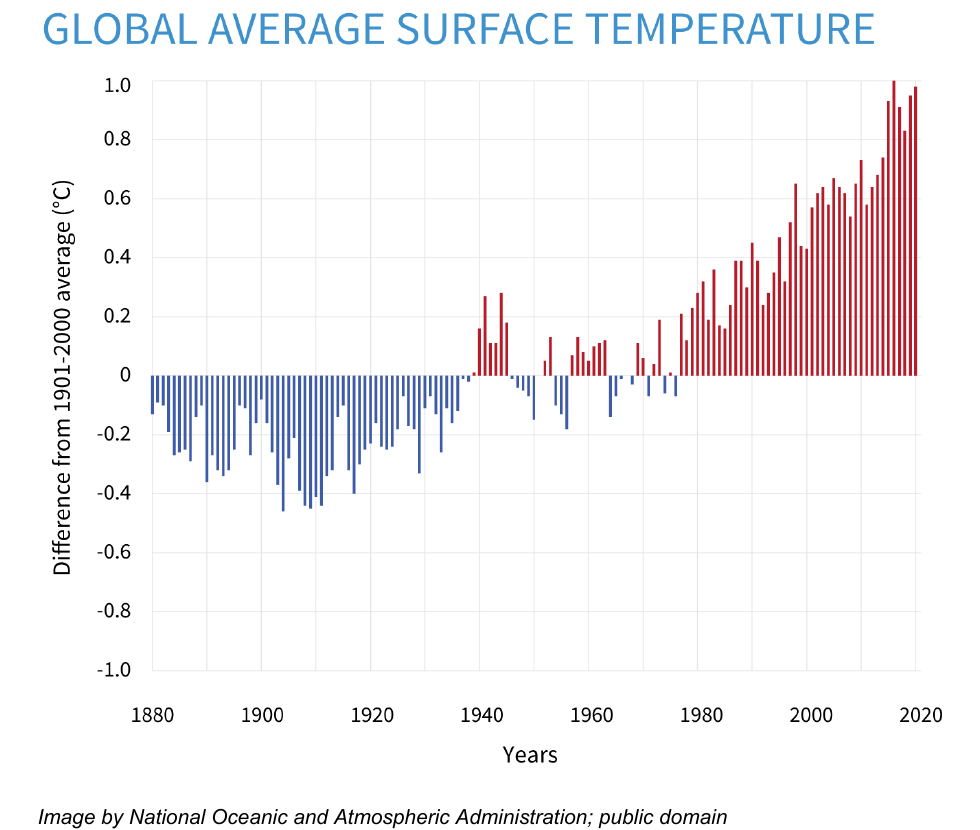
- Global average temperature has risen by about 1°C since the early 1900s, with some regions warming more than others.
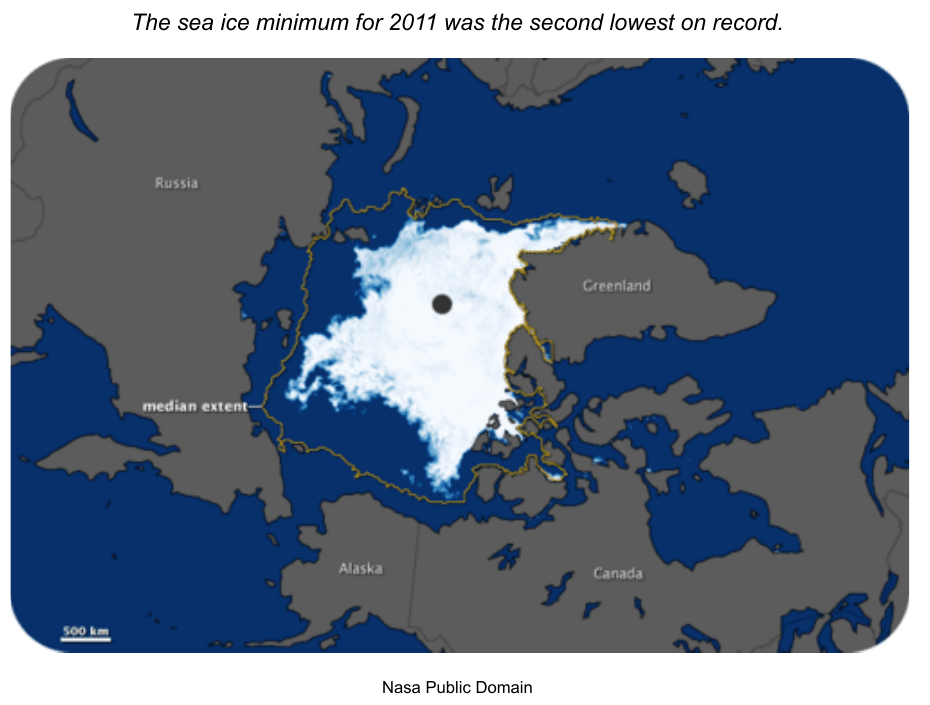
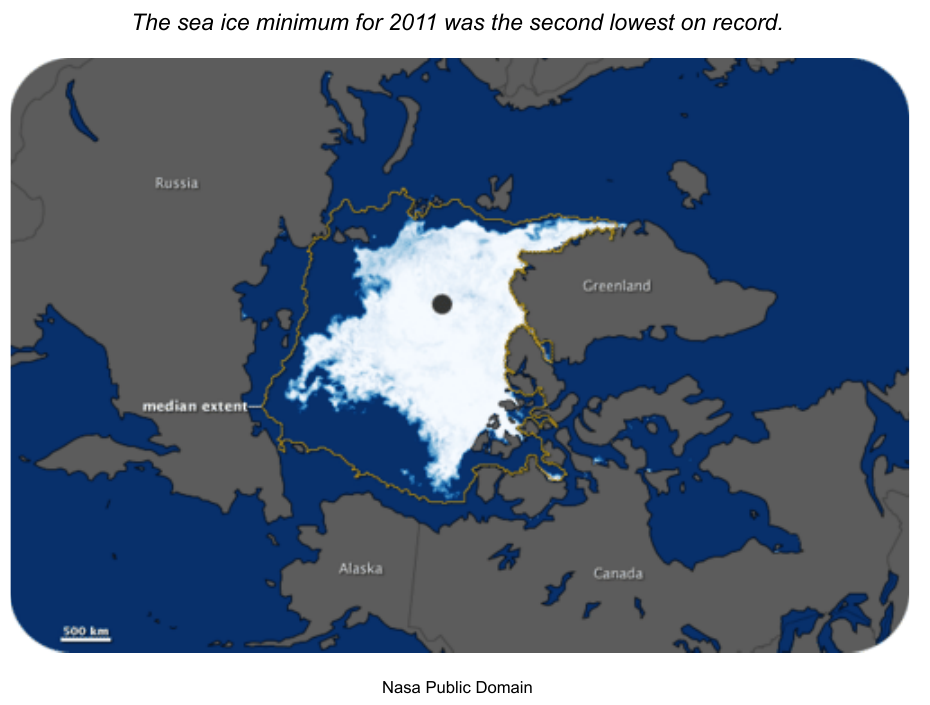
- Rising temperatures are melting polar ice: the Arctic's summer sea-ice minimum in 2011 was much smaller than the 1979-2000 average, and sea level has risen about 9 inches since the late 1800s.
- Changing temperatures shift regional weather patterns — more rainfall in some areas, drought in others — which affects agriculture and food production.
- Long-term climate change can push species and crops outside the temperature range they need to survive, leading to habitat loss and, in some cases, extinction.
Arctic sea ice minimum extent in 2011 (white) compared with the 1979-2000 median extent (yellow outline)
投影片
練習題
免費預覽——43 題中的 8 題。註冊即可查看全部。
1.The greenhouse effect is a natural process that helps keep Earth warm enough to support life.
EasyTrue or false?
2.Which of the following is NOT a greenhouse gas?
Easy- AOxygen
- BCarbon dioxide
- CMethane
- DWater vapour
3.Mars has a thicker atmosphere than Earth, which causes its surface to be warmer than Earth's.
EasyTrue or false?
4.What is the approximate average surface temperature of Earth with the natural greenhouse effect?
Easy- A-18°C
- B15°C
- C59°C
- D0°C
5.Which gas is the most abundant greenhouse gas in Earth's atmosphere?
Easy- ACarbon dioxide
- BWater vapour
- CMethane
- DOzone
6.Which of the following is a human activity that increases the amount of carbon dioxide in the atmosphere?
Easy- APlanting trees
- BBurning fossil fuels
- CUsing solar panels
- DRecycling paper
7.Which of the following are human activities that contribute to the increase of greenhouse gases in the atmosphere? (Select all that apply)
Medium- ABurning fossil fuels
- BDeforestation
- CPlanting trees
- DRaising livestock
- EUsing solar panels
8.Which of the following is a method used by scientists to study past carbon dioxide levels?
Medium- AAnalyzing ice cores
- BMeasuring ocean temperature
- CObserving volcanic eruptions
- DCounting tree rings